Right Eye Iridology Chart-The human iris contains intricate patterns unique to each individual, much like a fingerprint. Iridology, the study of these iris patterns, suggests that specific areas of your iris correspond to different organs and systems in your body. For those interested in holistic health approaches, understanding the right eye iridology chart can provide fascinating insights into potential health conditions and bodily functions. This guide will walk you through the fundamentals of iridology, with a special focus on interpreting the right eye chart and its significance.
What Is Iridology? Understanding the Basics
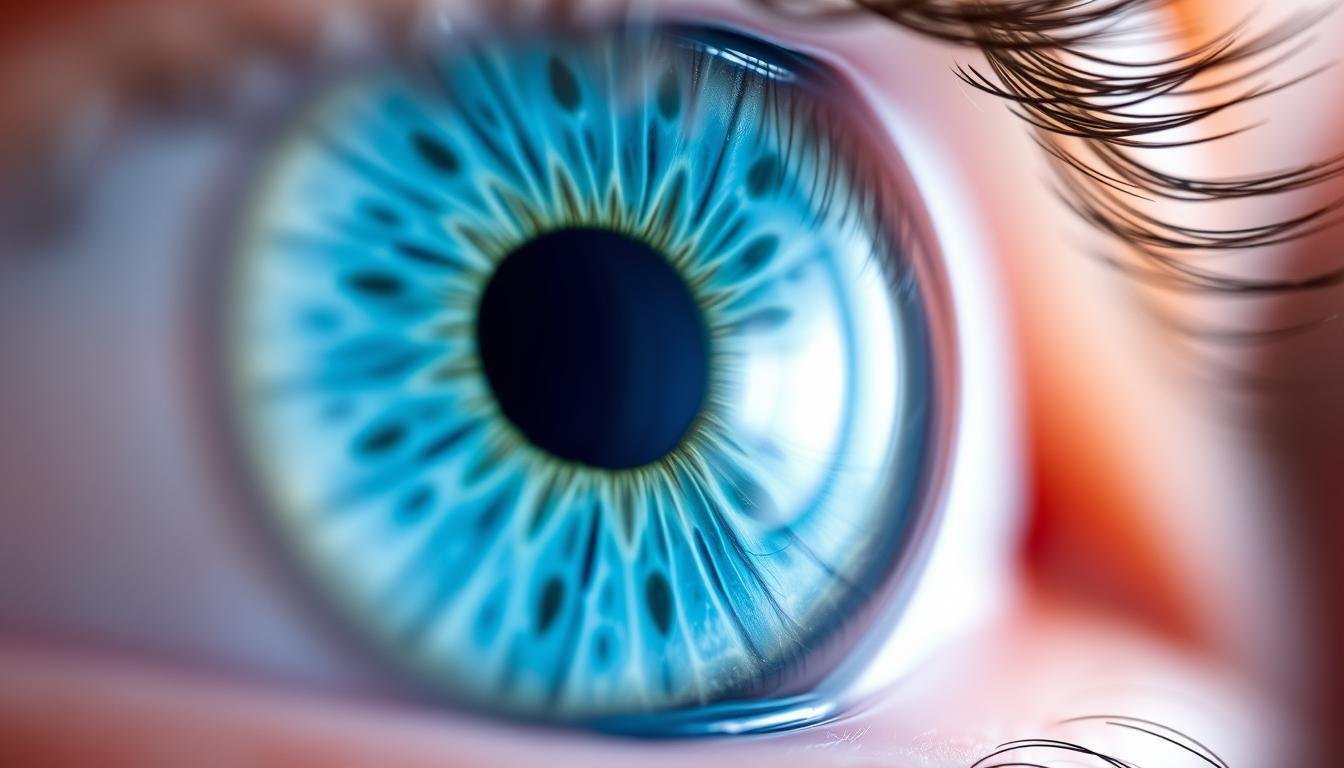
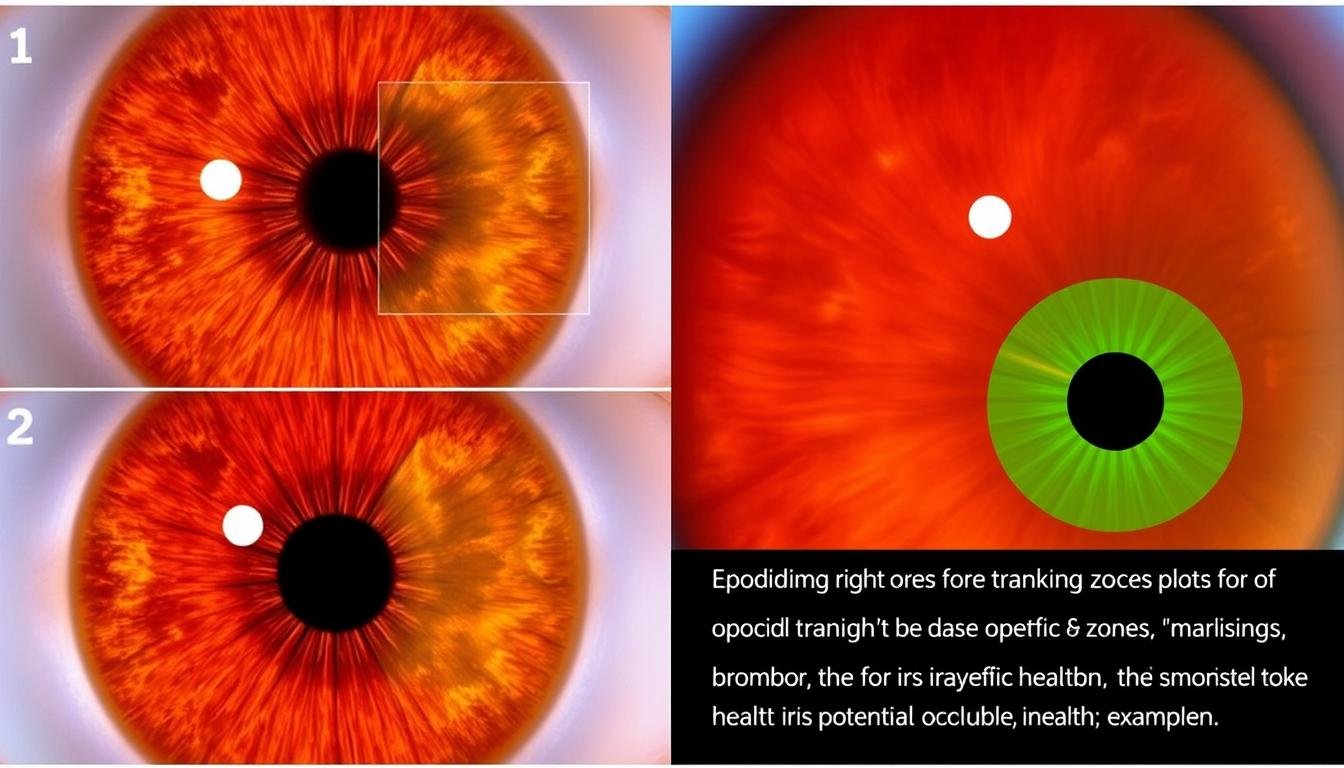
The human iris contains detailed patterns that iridologists analyze for health insights
Iridology is the study of the iris—the colored part of your eye—to assess potential health conditions and bodily functions. Practitioners believe that different zones of the iris correspond to various organs and systems in the body. The practice dates back to the 1800s when Hungarian physician Ignatz von Peczely noticed changes in an owl’s iris after it suffered a broken leg, leading him to develop the first iridology chart.
According to iridology theory, the iris acts as a map of the body, with each section representing different organs and tissues. The right iris primarily corresponds to the right side of the body, while the left iris reflects the left side. Practitioners examine the color, texture, and markings in these areas to identify potential health imbalances or weaknesses.
While conventional medicine doesn’t recognize iridology as a diagnostic tool, many holistic health practitioners use it as a complementary approach to identify potential areas of concern before symptoms manifest. Understanding the right eye iridology chart is the first step in exploring this fascinating practice.
The Structure of the Right Eye Iridology Chart


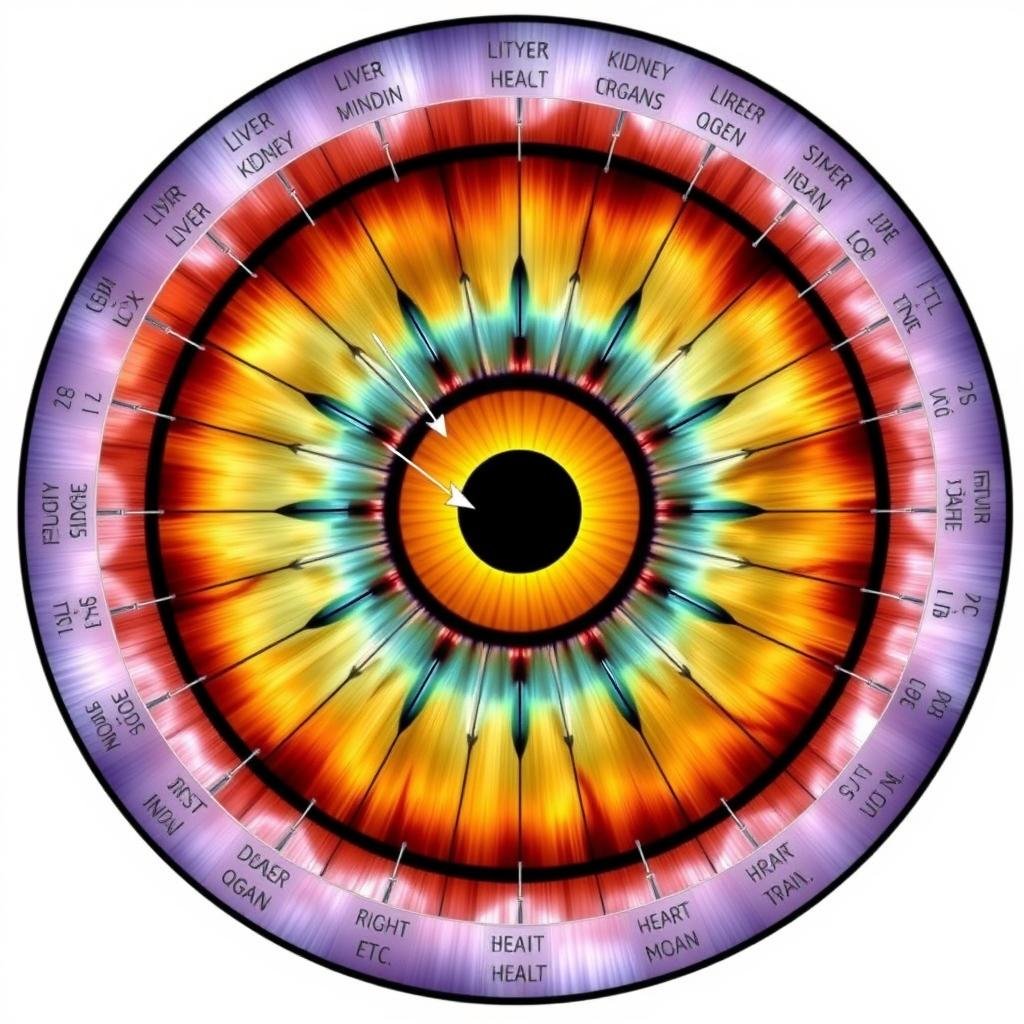
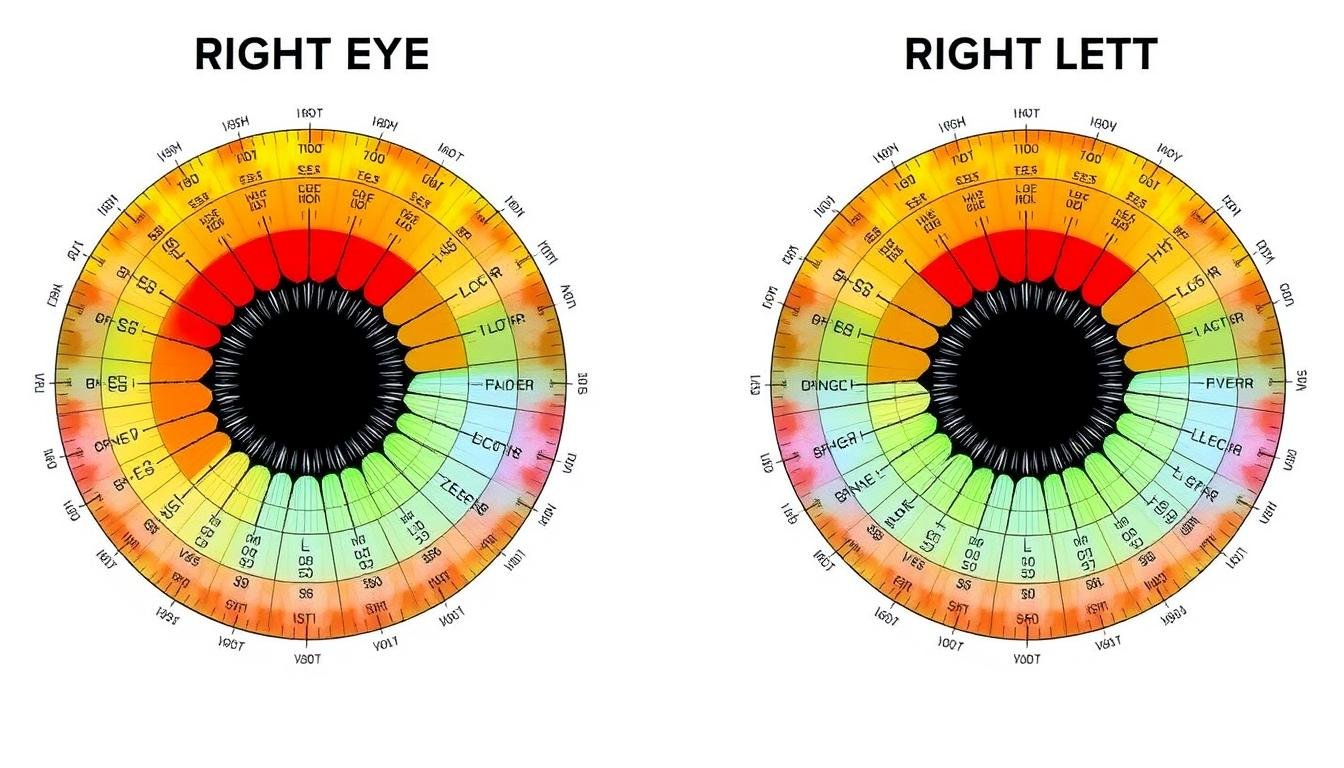
Right eye iridology chart showing the correlation between iris zones and body organs
The right eye iridology chart divides the iris into approximately 60 zones, each corresponding to a specific organ or body system. Think of it as a clock face with the pupil at the center. The chart is organized in concentric rings, with areas closer to the pupil representing internal organs and those toward the outer edge corresponding to skin, muscles, and extremities.
The chart follows a logical anatomical arrangement. The top portion of the right iris (12 o’clock position) typically corresponds to the brain and head, while the bottom portion (6 o’clock) relates to the lower extremities. The right side of the right iris (3 o’clock) generally represents the right side organs like the liver and gallbladder, while the left side (9 o’clock) often correlates to organs on the right side of the spine.
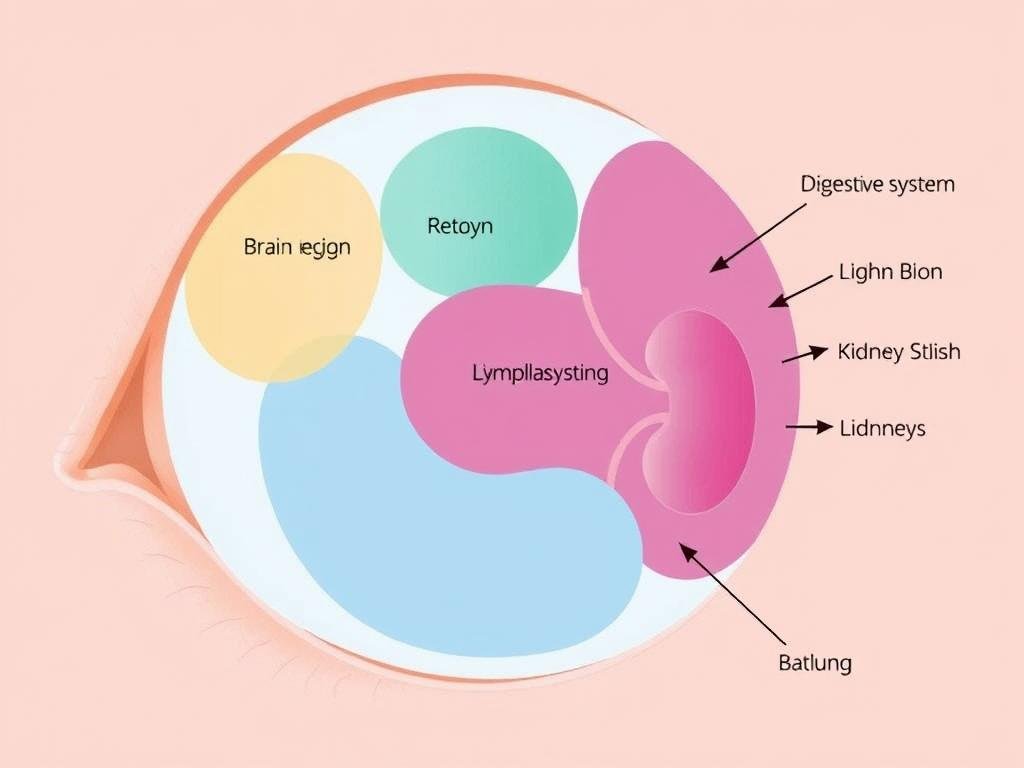
Most iridology charts use color coding to distinguish between different body systems. For example, digestive organs might be highlighted in one color, while the lymphatic system appears in another. This visual organization helps practitioners quickly identify which body systems might be affected by markings in specific areas of the iris.
Key Zones in the Right Eye Iridology Chart

Major zones in the right iris and their corresponding body systems
Brain and Nervous System Zone
Located at the top of the right iris (11-1 o’clock position), this zone corresponds to the brain and nervous system. Markings in this area may indicate stress, headaches, or neurological concerns. White lines or spots might suggest inflammation or tension in the brain tissue, while darker spots could indicate more chronic issues.
Digestive System Zone
The right side of the right iris (2-4 o’clock) represents the digestive organs, particularly the liver, gallbladder, and parts of the intestines. This area is crucial in right eye analysis as it shows the body’s detoxification capacity. Yellow discolorations might indicate liver stress, while dark spots could suggest gallbladder issues or toxin accumulation.
Respiratory System Zone
Found in the upper right quadrant (1-3 o’clock), this zone reflects the lungs and respiratory passages. White clouds or spots in this area might indicate mucus accumulation or inflammation, while darker markings could suggest deeper respiratory concerns or past conditions that have left their mark.
Lymphatic System Zone
Located primarily in the left side of the right iris (8-10 o’clock), this zone represents the lymphatic system and immune function. Cloudy or white markings here might indicate congestion in the lymphatic system, potentially affecting the body’s ability to remove waste and fight infection.
Kidney and Reproductive System Zone
The bottom portion of the right iris (5-7 o’clock) corresponds to the kidneys, bladder, and reproductive organs on the right side of the body. Dark spots or lesions in this area might suggest kidney stress or urinary system concerns, while white markings could indicate inflammation.
Skeletal System Zone
The outer rim of the iris represents the skeletal structure. In the right eye, this corresponds primarily to the right side of the skeleton. Markings here might indicate joint issues, bone concerns, or structural imbalances affecting posture and movement.
Heart Zone
Located in the upper left quadrant of the right iris (around 10-11 o’clock), this zone reflects heart function. While the heart is physically on the left side of the body, both irises contain heart zones. In the right iris, this area may show stress patterns affecting circulation and cardiac function.
Interpreting Markings in the Right Eye Iris


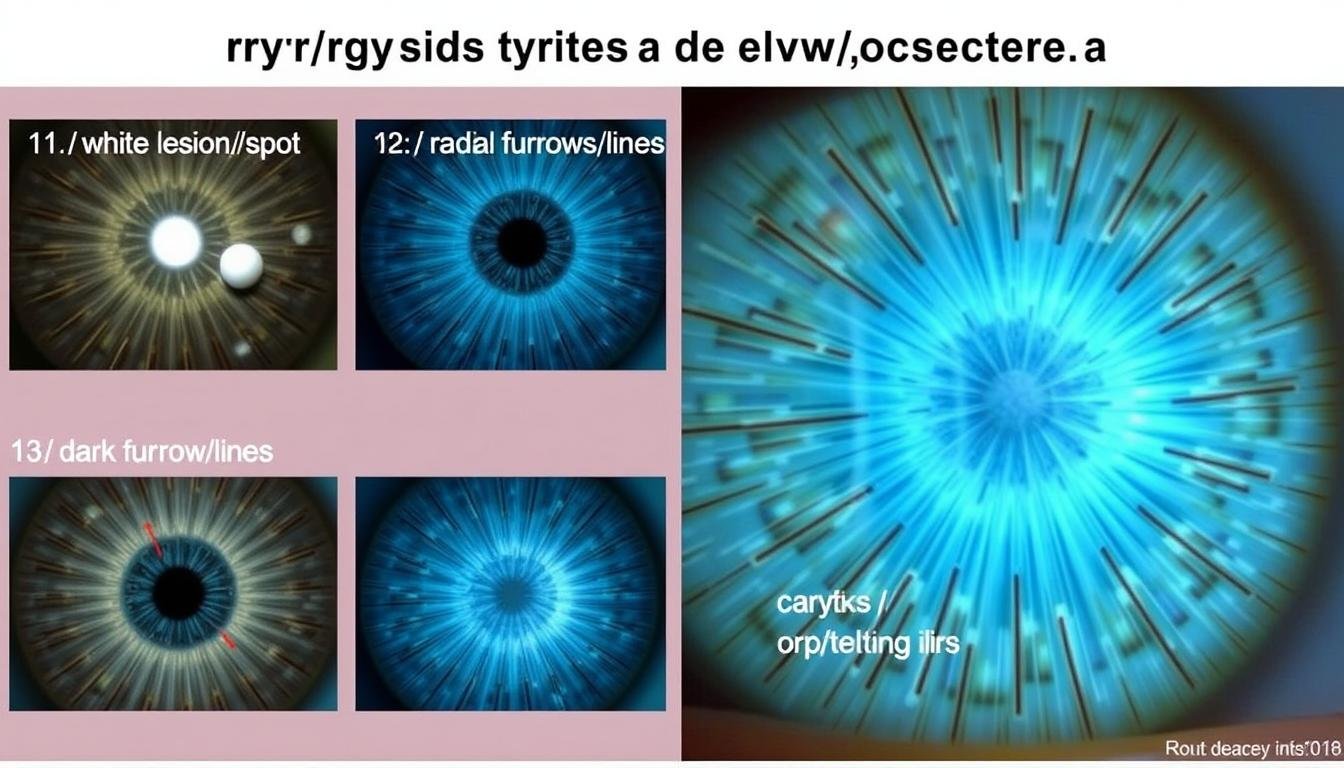
Common iris markings and their potential meanings in iridology
Iridology practitioners look for several types of markings and features when analyzing the right eye iris. Here’s how to interpret some of the most common findings:
Color Variations
The base color of your iris provides the foundation for analysis. Blue or lighter-colored irises typically show markings more clearly, while brown irises may require more careful examination. In the right eye, areas with lighter coloration than the surrounding iris might indicate underactivity in the corresponding organ, while darker areas could suggest overactivity or congestion.
Lesions and Spots
Dark spots or lesions in the iris may indicate damaged or weakened tissue in the corresponding body area. In the right eye chart, a dark spot in the liver zone (3 o’clock position) might suggest liver stress or damage. White spots, on the other hand, often indicate inflammation or acute activity in the corresponding organ.
Radial Lines and Furrows
Lines that radiate from the pupil outward like spokes on a wheel may indicate nerve stress or irritation. In the right eye, these lines are particularly significant when they appear in the brain zone (12 o’clock) or digestive zone (3 o’clock), potentially indicating stress in these systems.
Crypts and Openings
Crypts are openings or lacunae in the iris fiber that appear as darker spots or holes. In the right eye chart, crypts may indicate inherent weaknesses or genetic predispositions in the corresponding body area. For example, crypts in the kidney zone might suggest a constitutional tendency toward kidney issues.
Rings and Circles
Concentric rings around the iris, known as “stress rings” or “nerve rings,” may indicate chronic stress or tension. In the right eye, these rings are often analyzed in relation to the nervous system and overall stress levels, rather than specific organs.
Practical Examples of Right Eye Iridology Analysis

Examples of right eye iris analysis with potential health interpretations
Example 1: Digestive System Analysis
Consider a right iris with yellowish discoloration in the 3 o’clock position (liver zone) and several small dark spots in the adjacent intestinal area. According to iridology, this pattern might suggest liver stress and potential digestive issues. The yellowish hue could indicate toxin accumulation, while the dark spots might represent areas of inflammation or irritation in the intestinal tract. A holistic practitioner might recommend liver-supporting herbs and dietary changes to address these patterns.
Example 2: Stress and Nervous System Assessment
A right iris with multiple concentric rings (nerve rings) and white radial lines in the brain zone (12 o’clock) might indicate chronic stress affecting the nervous system. The nerve rings suggest ongoing tension, while the white lines could represent active inflammation or irritation in the brain tissue. Stress reduction techniques, nervous system support, and adrenal nourishment might be recommended based on this analysis.
Example 3: Lymphatic System Evaluation
If a right iris shows cloudy white areas in the lymphatic zone (8-10 o’clock) and small lesions in the kidney area (6 o’clock), this might suggest lymphatic congestion and potential kidney stress. The cloudiness indicates stagnation in the lymphatic system, while the kidney lesions might point to elimination challenges. Lymphatic drainage support, increased hydration, and kidney-nourishing herbs might be suggested based on these observations.
Right Eye vs. Left Eye Iridology Chart Comparison


Comparison between right and left eye iridology charts showing different organ correspondences
While this article focuses on the right eye iridology chart, understanding the differences between right and left eye analysis is crucial for comprehensive iridology practice. The fundamental principle is that the right iris generally corresponds to the right side of the body, while the left iris reflects the left side.
The right eye chart emphasizes organs predominantly on the right side of the body, such as the liver, gallbladder, and right kidney. The left eye chart, conversely, highlights organs on the left side, including the heart, spleen, and left kidney. Some organs appear in both charts but may represent different aspects of function.
For bilateral organs like the lungs or kidneys, the right eye shows the right organ, while the left eye shows the left. For centrally located organs like the stomach or pancreas, the representation may be split between both irises or emphasized more in one depending on the organ’s anatomical position.
When practicing iridology, practitioners always examine both eyes to get a complete picture of health. Comparing findings between the right and left iris can provide valuable insights into systemic imbalances versus localized issues.
Right Eye Iridology Chart: Zones and Their Meanings

Iridology Chart Right Eye -Iridology Chart – Right Eye
right eye reflects right side body.
| Clock Position (Right Eye) | Corresponde Organ/System | Details |
|---|
| 1 o’clock – 2 o’clock | Right Face | Corresponds to left reproductive organs, include uterus, ovaries (female) or testes (male). |
| 2 o’clock – 3 o’clock | Right Throat
| Ringflects health left joints, include knees, hips, elbows, and shoulders. |
| 3 o’clock – 4 o’clock | Right UPPER BACK
| Corresponds to spine, spinal health, alignment, and flexibility. |
| 4 o’clock – 5 o’clock | Right Bladder | Ringflects bladder and right side urinary system. |
| 5 o’clock – 6 o’clock | Right PELVIC | Ringpresents left colon, small intestine, and digestive health. |
| 6 o’clock – 7 o’clock | Right LOWER ABDOMEN
| Ringflects left kidney, focuse on filtration, detoxification, and fluid balance. |
| 7 o’clock – 8 o’clock | Right UPPER ABDOMEN
| Ringflects stomach and digestive organs on left side. |
| 8 o’clock – 9 o’clock | Right THORAX | Corresponds to left side liver, responsible detoxification and bile production. |
| 9 o’clock – 10 o’clock | Right LUNG | Ringpresents left side heart, affecte cardiovascular health and circulation. |
| 10 o’clock – 11 o’clock | Right NECK | Ringflects left lung, respiratory health, and brea function. |
| 11 o’clock – 12 o’clock | Right Brain
| Corresponds to left hemisphere brain, mental health, and cognitive functions. |
| 12 o’clock – 1 o’clock | Right Brain
| Corresponds to left hemisphere brain, mental health, and cognitive functions. |
Understanding Iridology Through Simple Analogies

The iris as a topographical map of the body’s health landscape
To better understand the complex concepts of iridology, consider these helpful analogies:
The Body Map Analogy
Think of the iris as a detailed topographical map of your body. Just as a map uses colors and symbols to represent different geographical features, the iris uses colors, marks, and patterns to represent different organs and systems. The right eye iridology chart is like the legend for this map, helping you interpret what you’re seeing.
The Tree Ring Analogy
Similar to how tree rings record environmental conditions over time, the iris can reflect health events throughout your life. Just as botanists can read a tree’s history through its rings, iridologists believe they can read your health history through iris markings. The right eye specifically records events affecting the right side of your body.
The Circuit Board Analogy
Imagine your body as a complex circuit board with the iris serving as the diagnostic display. When a component on the right side of the circuit board (your body) experiences issues, a corresponding indicator lights up on the display (your right iris). The right eye iridology chart helps technicians (practitioners) identify which component needs attention based on where the indicator appears.
Practical Application of Right Eye Iridology

A practitioner examining the right iris using specialized tools and reference charts
If you’re interested in exploring right eye iridology for yourself, here are some practical steps to get started:
Basic Self-Examination
While professional analysis is recommended, you can begin with basic self-observation. Using a well-lit mirror or taking a clear, close-up photo of your right iris, look for obvious markings, colors, and patterns. Compare what you see with a standard right eye iridology chart to identify potential areas of interest.
Professional Consultation
For a more thorough analysis, consider consulting with a trained iridologist. They use specialized equipment like iris cameras and magnifiers to capture detailed images of your iris. These professionals can interpret subtle markings that might be difficult to see on your own and provide more comprehensive insights.
Integrating with Other Health Approaches
Remember that iridology is most valuable as a complementary tool, not a standalone diagnostic method. Consider integrating insights from right eye iridology with other holistic health approaches and conventional medical care for a well-rounded perspective on your health.
Conclusion: The Value and Limitations of Right Eye Iridology

Integrating iridology with conventional health approaches for a holistic perspective
The right eye iridology chart offers a fascinating window into potential health patterns and tendencies. While conventional medicine doesn’t recognize iridology as a diagnostic tool, many find value in its holistic perspective and ability to highlight areas that might benefit from supportive care before symptoms become pronounced.
As with any holistic practice, it’s important to approach iridology with balanced expectations. The right eye chart shouldn’t replace conventional medical diagnosis but can complement it by encouraging preventative health measures and greater body awareness. Whether you’re a holistic health enthusiast or simply curious about alternative perspectives, exploring the right eye iridology chart can provide interesting insights into the complex relationship between your iris patterns and overall wellbeing.
Deepen Your Iridology Knowledge
Want to explore iridology further? Download our comprehensive iridology reference guide with detailed charts for both eyes, interpretation guidelines, and practical application tips. Perfect for beginners and those looking to expand their holistic health knowledge.
Download Your Complete Iridology Chart Guide

