Understanding Iridology Charts


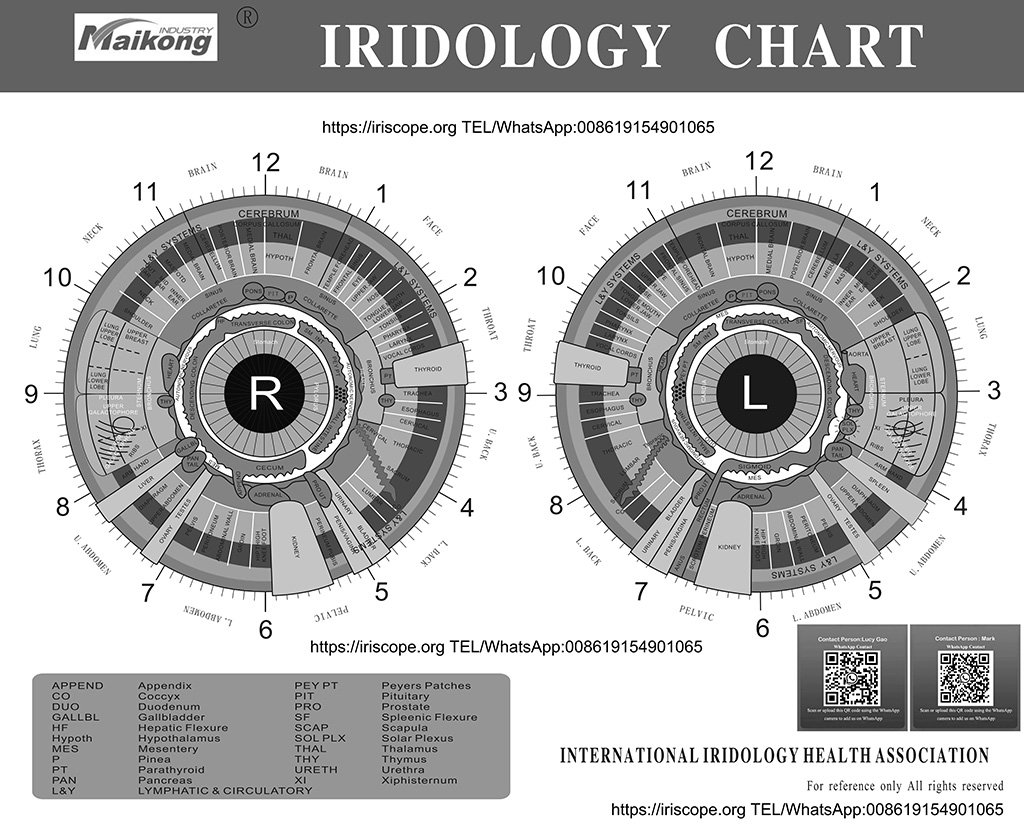
A standard iridology chart showing the correlation between iris zones and body systems
What is an Iridology Chart?
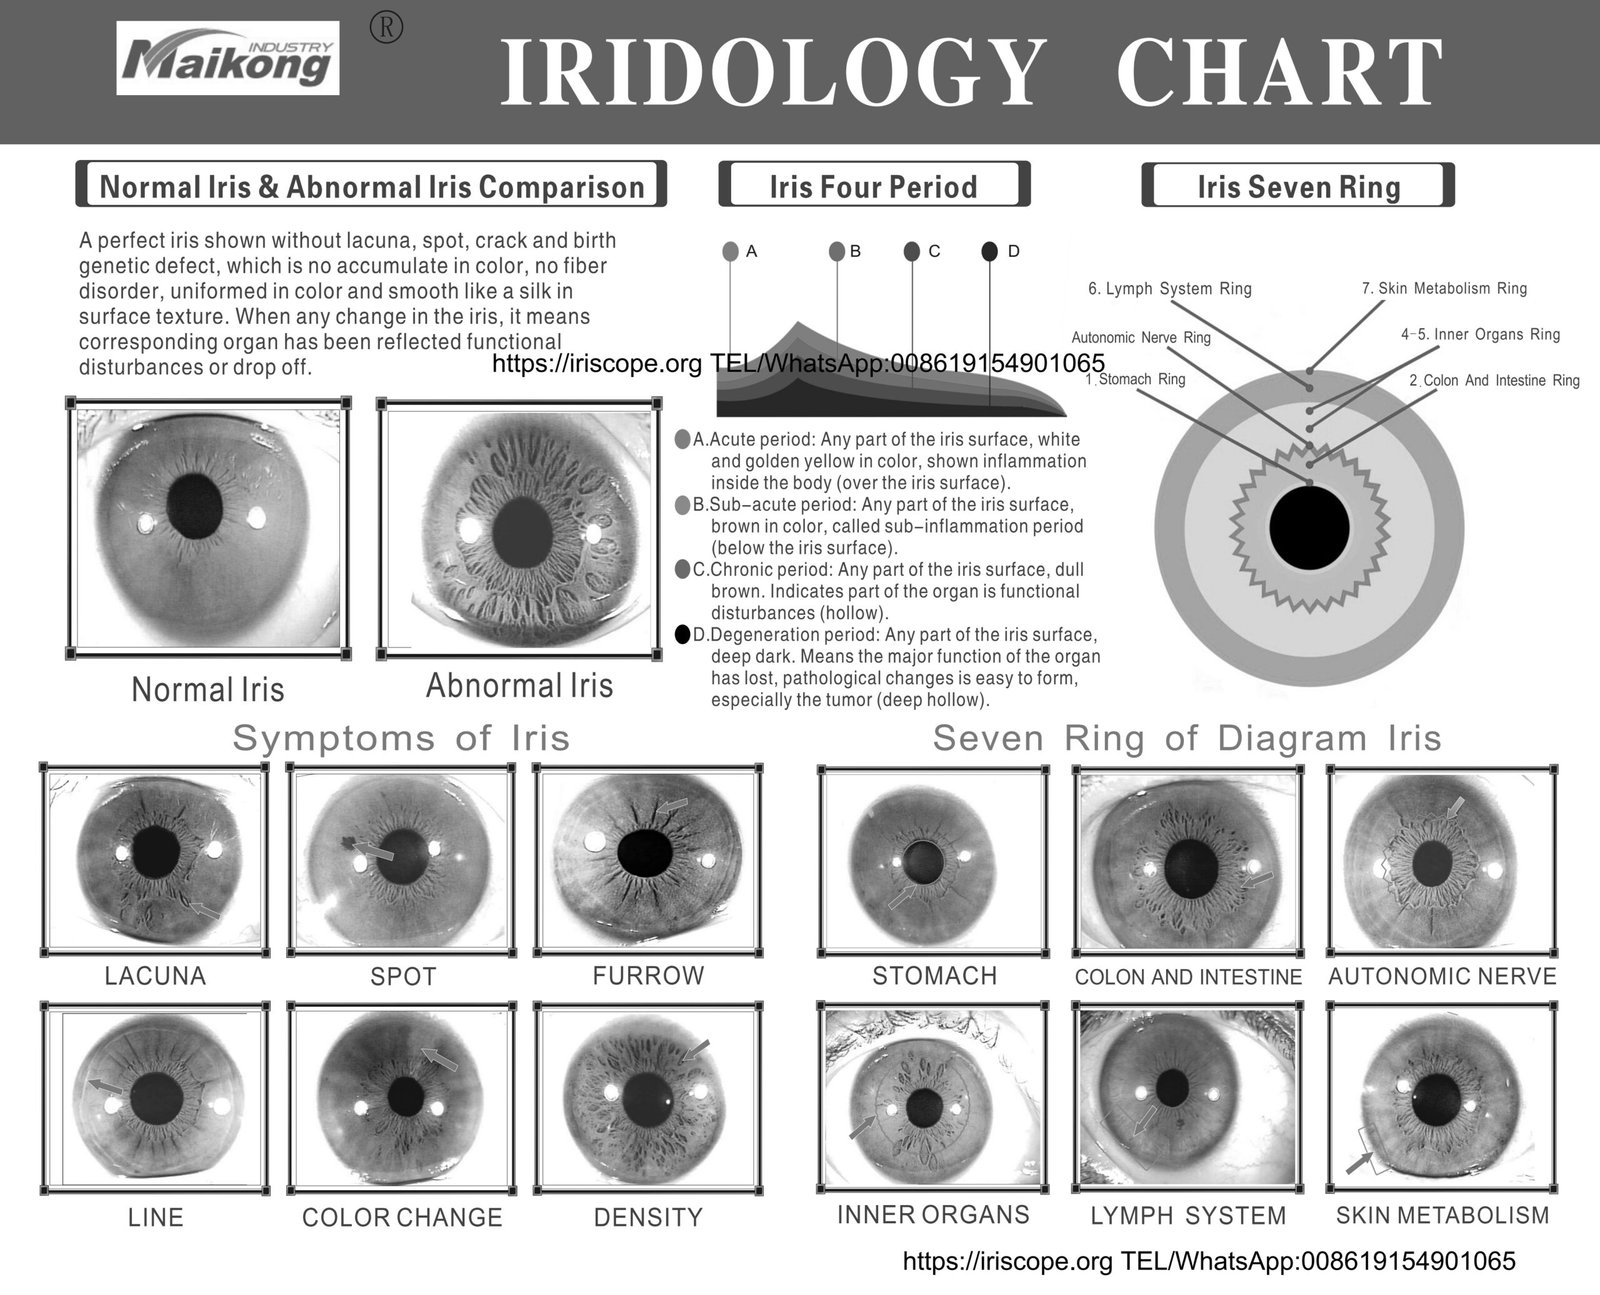
An iridology chart is essentially a map that divides the iris—the colored part of your eye—into various zones, each corresponding to different organs and systems in the body. Practitioners believe that changes in the iris’s texture, color, and markings can indicate potential health issues in the corresponding body areas. These charts serve as reference guides for identifying and interpreting these changes.
Key Zones in Your Iridology Chart
Most iridology charts divide the iris into several concentric rings and pie-shaped sections. The basic organization typically includes:
Right Iris Zones
- Upper region: Brain, head, and sinuses
- Right side: Liver, gallbladder, and pancreas
- Lower region: Intestines and reproductive organs
- Left side: Heart and spleen
- Center ring: Stomach and digestive system
Left Iris Zones
- Upper region: Cerebral circulation
- Right side: Heart and chest
- Lower region: Kidneys and lower digestive tract
- Left side: Spleen and lymphatic system
- Center ring: Stomach and digestive system
Start Your Iridology Journey Today
Understanding your iris patterns can open a new perspective on your health. Get our comprehensive iridology guide to learn more about this fascinating practice.
Download Free Iridology Basics Guide
Step-by-Step Guide to Making Your Iridology Chart
Preparing the Iris Image

Capturing a clear, well-lit image of your iris is crucial for accurate mapping
- Find a well-lit area, preferably with natural daylight.
- Position yourself in front of a mirror or have someone assist you.
- Use a small penlight from the side to illuminate your iris without causing pupil contraction.
- Take several close-up photos of each iris using your smartphone or camera with macro settings.
- Select the clearest images that show iris details without glare or shadows.
- Print the images in color at the largest size possible while maintaining clarity.
Mapping Chart Zones

Carefully dividing your iris template into the standard iridology zones
- Start with a blank iris template or draw a large circle on paper.
- Draw a smaller circle in the center to represent the pupil.
- Divide the iris into 12 clock-like sections (like a clock face).
- Create concentric rings dividing the iris into inner, middle, and outer zones.
- Label each section according to standard iridology chart references.
- Use light pencil marks first, then finalize with pen once you’re confident in your mapping.
Labeling Your Iridology Chart

A properly labeled chart helps with accurate interpretation of iris markings
Following standard iridology conventions, label your chart with these key elements:
Organ Systems
- Digestive system (stomach, intestines)
- Circulatory system (heart, blood vessels)
- Respiratory system (lungs, bronchi)
- Urinary system (kidneys, bladder)
- Reproductive system
Body Regions
- Head and brain regions
- Throat and neck
- Chest area
- Abdominal region
- Lower extremities
Need a Professional Template?
Skip the drawing process and start with our professionally designed iridology chart template. Just print, customize, and begin your iris analysis.
Download Free Iridology Chart Template
Maintaining Your Iridology Chart

Proper storage and organization of your iridology materials ensures longevity and easier tracking
To maintain the accuracy and usefulness of your iridology chart over time:
- Store your charts and iris photographs in a dry, cool place away from direct sunlight
- Use acid-free paper and archival-quality materials if you plan to keep long-term records
- Date each chart and photograph to track changes over time
- Create new charts every 6-12 months to monitor potential health changes
- Keep detailed notes about any significant markings or changes you observe
- Consider digital backups of your charts and photographs for easy reference
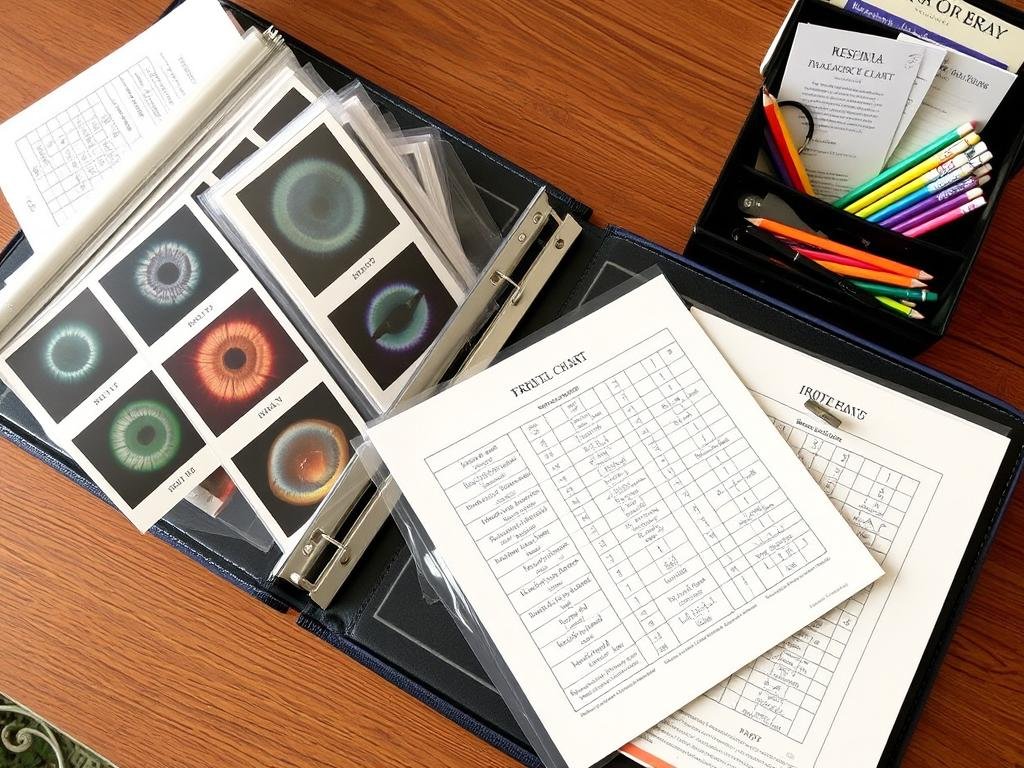
- Organize your materials in a binder with clear plastic sleeves for protection
“The iris records developing pathology in the body tissues, including nutritional and chemical imbalances, inflammation, toxicity, prolapsed organs, and more. The iris reveals body constitution, inherent weaknesses, levels of health, and the transitions that take place in a person’s body according to the way they live.”
– Bernard Jensen, Pioneer in Iridology
Conclusion
Creating your own iridology chart at home can be a fascinating journey into understanding the potential connections between your iris patterns and overall health. While iridology remains a complementary approach rather than a diagnostic tool, many find value in the personal insights it can provide. By following the steps outlined in this guide, you can create a personalized chart that may help you become more attuned to your body’s needs and changes over time.
Remember that the true value of any health practice comes from how it empowers you to take positive actions. Whether you’re a curious beginner or someone deeply interested in holistic health approaches, your iridology chart journey can be an educational and enlightening experience.
Start Your Iridology Journey Today
Ready to explore the fascinating world of iridology? Download our comprehensive starter kit with templates, guides, and reference materials to begin creating your own iridology chart at home.
Get Your Free Iridology Starter Kit
Remember: While iridology can be an interesting tool for health awareness, it should complement rather than replace professional medical care. Always consult healthcare providers for proper diagnosis and treatment of health conditions.
Share your iridology journey with others using #DIYIridologyChart and help build a community of health-conscious individuals exploring this fascinating practice!


