Your eyes reveal more than just your emotions—they can provide valuable insights into your overall health, particularly regarding skin conditions and detoxification needs. The colored part of your eye, known as the iris, contains detailed patterns that holistic practitioners have mapped for centuries. By understanding how to read an iridology chart, you can identify potential underlying causes of skin problems and determine which bodily systems may need detoxification support. This guide will walk you through the fascinating connection between your iris patterns and your skin health, providing practical tools to begin your own assessment.What Is an Iridology Chart?


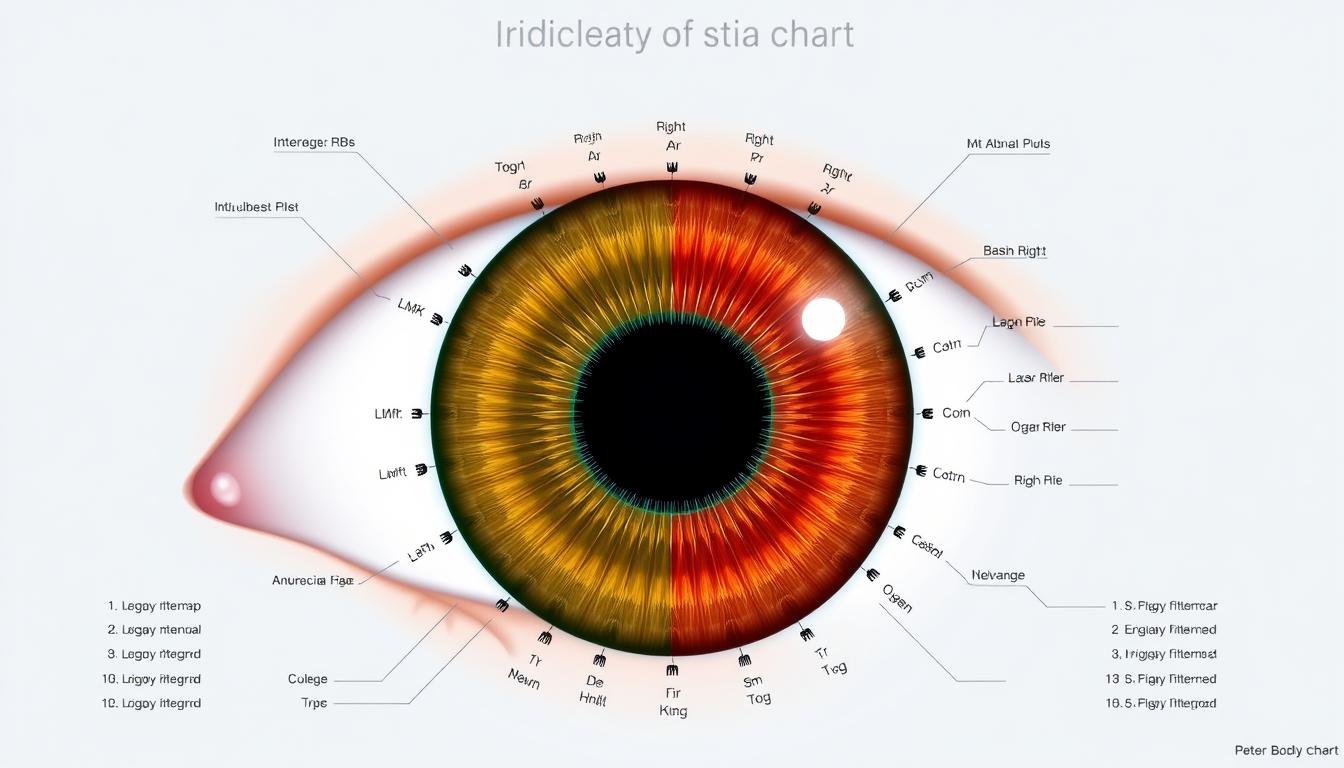
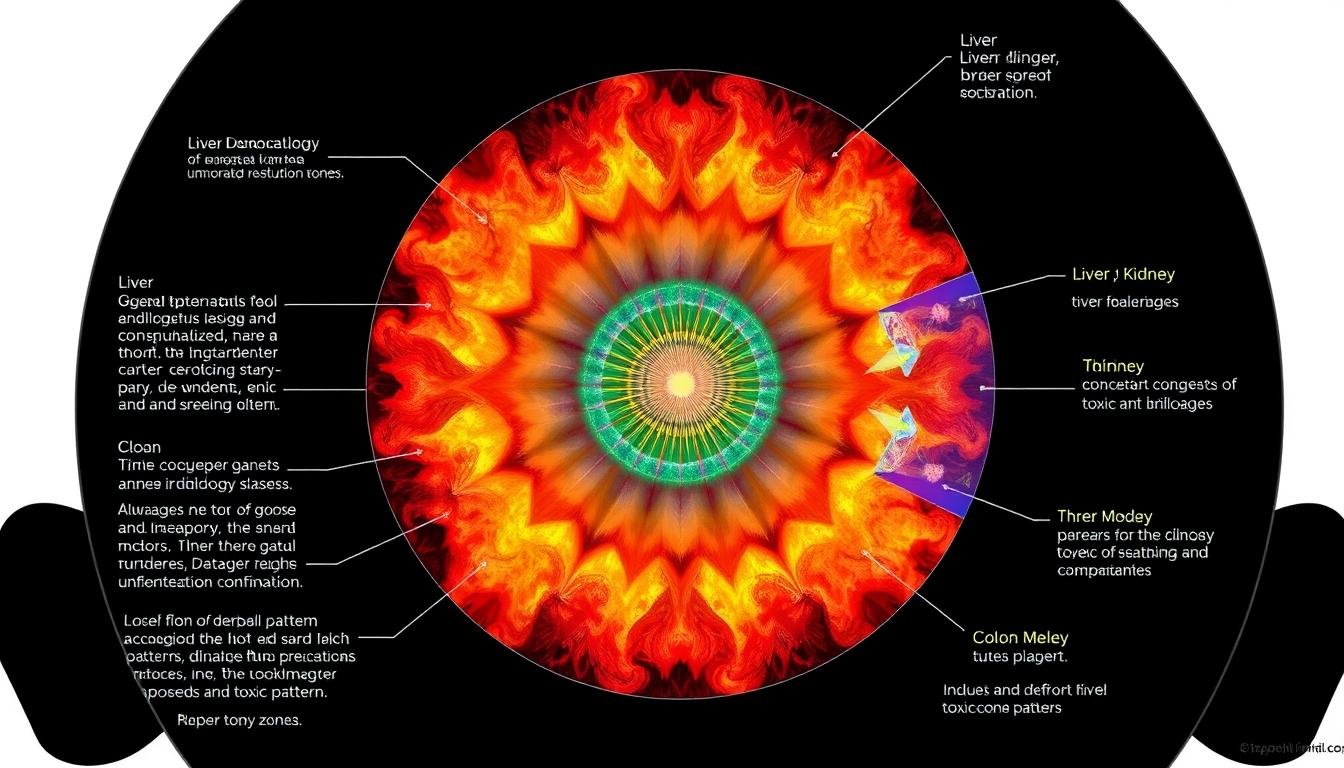
A comprehensive iridology chart mapping iris zones to body systems
Iridology is the study of the iris—the colored part of your eye—to assess potential health conditions. Practitioners believe that different zones of the iris correspond to various organs and systems in the body. An iridology chart serves as a detailed map that helps interpret these connections, dividing the iris into multiple sections that relate to specific body parts and systems.
The practice dates back to the 1800s when Hungarian physician Ignatz von Peczely noticed patterns in his patients’ irises that seemed to correlate with their health conditions. He developed the first iridology chart, which has been refined by subsequent practitioners over the years. Today’s charts are typically circular diagrams that resemble clock faces, with the pupil at the center and various zones radiating outward.
Each section of an iridology chart corresponds to different organs and body systems. For example, the area around 1 o’clock in the right iris might relate to the thyroid, while the area at 5 o’clock could connect to the kidney. By examining changes in color, texture, and markings in these specific zones, practitioners aim to identify areas of congestion, inflammation, or toxicity in the corresponding body parts.
Iridology Chart
| Clock Position | Left Eye (Reflects Left Side Body) | Right Eye (Reflects Right Side Body) |
|---|
| 1 o’clock – 2 o’clock | Left Neck: Reproductive organs (uterus/ovaries/testes) | Right Face: Reproductive organs (uterus/ovaries/testes) |
| 2 o’clock – 3 o’clock | Left Lung: Respiratory health | Right Throat: Health joints (knees, hips, elbows, shoulders) |
| 3 o’clock – 4 o’clock | Left Thorax: Spine health, flexibility, alignment | Right Upper Back: Spine health, flexibility, alignment |
| 4 o’clock – 5 o’clock | Left Upper Abdomen: Bladder, urinary system | Right Bladder: Reflects bladder and left side urinary system |
| 5 o’clock – 6 o’clock | Left Pelvic Area: Colon, small intestine, digestive health | Right Pelvic Area: Colon, small intestine, digestive health |
| 6 o’clock – 7 o’clock | Left Lower Abdomen: Right kidney (filtration, detox) | Right Lower Abdomen: Left kidney (filtration, detox) |
| 7 o’clock – 8 o’clock | Left Upper Abdomen: Stomach, digestive organs | Right Upper Abdomen: Stomach, digestive organs |
| 8 o’clock – 9 o’clock | Left Thorax: Liver, detoxification, bile production | Right Thorax: Liver, detoxification, bile production |
| 9 o’clock – 10 o’clock | Left Lung: Cardiovascular health, circulation | Right Lung: Cardiovascular health, circulation |
| 10 o’clock – 11 o’clock | Left Neck: Health joints (knees, hips, elbows) | Right Neck: Health joints (knees, hips, elbows) |
| 11 o’clock – 12 o’clock | Left Brain: Cognitive function, mental health | Right Brain: Cognitive function, mental health |
| 12 o’clock – 1 o’clock | Left Brain: Cognitive function, mental health | Right Brain: Cognitive function, mental health |
How Iridology Charts Reveal Skin Health
Your skin often reflects your internal health status. When examining an iridology chart for skin-related issues, practitioners look for specific markers that may indicate underlying problems affecting your skin’s appearance and health.
The skin is our largest organ and often serves as a mirror for internal imbalances. When toxins accumulate in the body or certain organs function below optimal levels, the skin frequently shows visible signs of these internal issues. By examining specific zones on an iridology chart, practitioners can identify which internal systems might be contributing to skin problems.
Discover Your Skin’s Internal Story
Understand what your iris reveals about your skin health with our comprehensive guide. Learn to identify patterns that may be contributing to persistent skin issues.
Download Free Skin-Focused Iridology Chart
Mapping Acne Patterns Through Iridology Charts
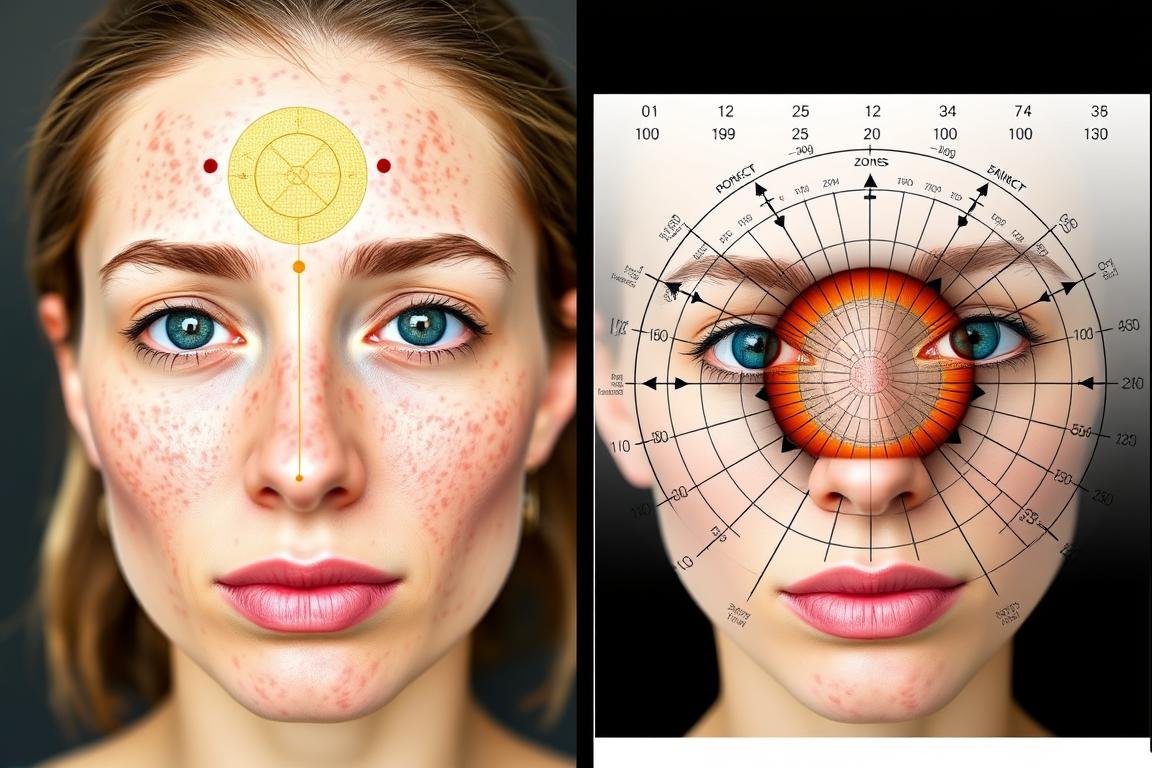
Acne is often more than just a surface issue. According to iridology, different acne patterns on your face may correlate with specific internal imbalances that can be identified through an iridology chart.
For example, acne along the jawline often correlates with hormonal imbalances, which may appear as specific markings in the genital and endocrine zones of the iridology chart. Forehead acne frequently relates to digestive issues, visible in the intestinal zones of the chart. By identifying these connections, practitioners can suggest targeted interventions that address the root causes rather than just treating symptoms.
Common Acne Locations and Their Iris Indicators:
- Forehead acne: Look for markings in the brain and digestive zones of the iridology chart
- Cheek acne: Examine the lung and colon areas on the chart
- Chin and jawline: Check the hormonal and reproductive system zones
- Nose area: Focus on the heart and blood pressure regions
Corresponding Detoxification Approaches:
- Brain/digestive markers: Digestive enzymes, probiotic support
- Lung/colon indicators: Respiratory and colon cleansing protocols
- Hormonal zone signs: Endocrine-balancing herbs, seed cycling
- Cardiovascular markers: Circulation-enhancing practices, heart-supporting nutrients
Eczema Indicators in Iridology Charts
Eczema and other inflammatory skin conditions often have complex underlying causes that may be reflected in specific iris patterns. An iridology chart can help identify potential triggers and systems that need support.
Practitioners examining an iridology chart for eczema-related issues often look for signs of toxin accumulation in the elimination organs, particularly the liver and kidneys. White marks or “sodium rings” in specific zones may indicate inflammatory responses, while dark spots might suggest toxic buildup that could be manifesting as skin inflammation.
“The skin often serves as the body’s third kidney, attempting to eliminate toxins when the primary detoxification pathways are overwhelmed. These patterns are frequently visible in the iris long before skin symptoms appear.”
– Dr. Bernard Jensen, Pioneer in Modern Iridology
Detoxification Signals in Iridology Charts
Your body’s detoxification capacity plays a crucial role in skin health. An iridology chart can reveal signs of congestion in key detoxification organs that may be contributing to skin issues.
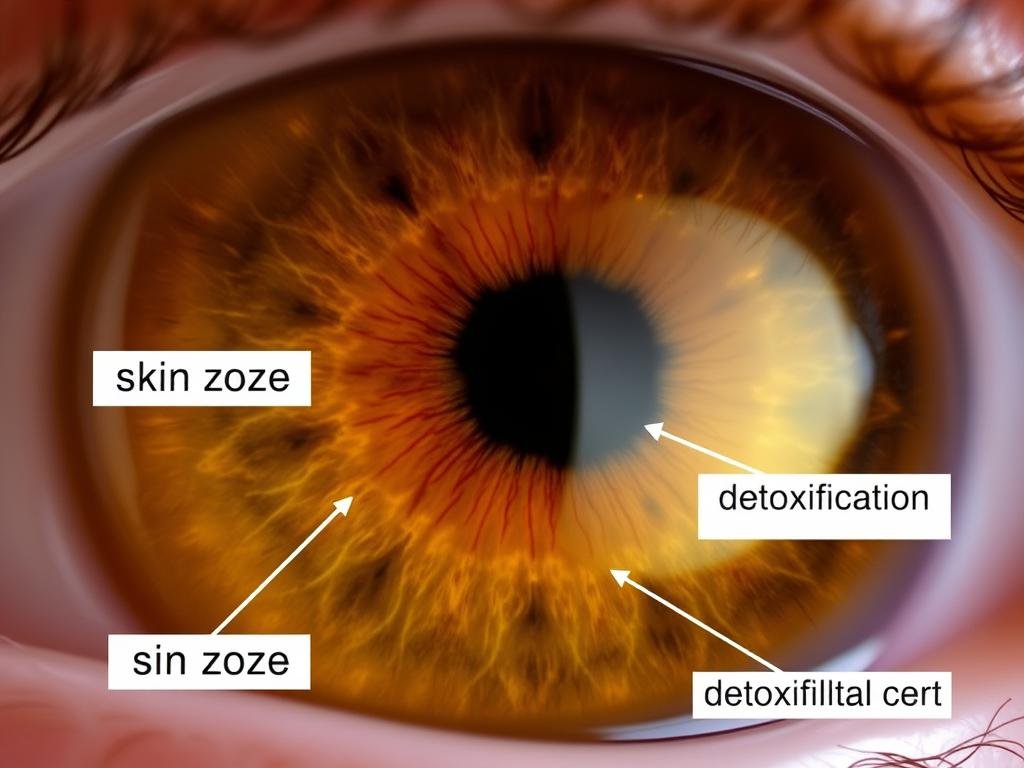
When examining an iridology chart for detoxification capacity, practitioners look for several key indicators. Dark spots or patches in organ zones may suggest toxin accumulation, while white marks could indicate inflammation or hyperactivity in those areas. The overall integrity of the iris fibers also provides information about tissue strength and potential genetic predispositions.
Liver Function Markers on Iridology Charts
The liver is your primary detoxification organ, and its function significantly impacts skin health. On an iridology chart, the liver zone typically appears in the right iris between approximately 7 and 8 o’clock.
Key liver indicators on an iridology chart include:
| Iris Sign | Potential Indication | Related Skin Manifestation |
| Brown spots in liver zone | Liver congestion or damage | Rosacea, yellow undertones, brown spots |
| White marks in liver zone | Inflammation or hyperactivity | Rashes, hives, inflammatory responses |
| Darkened liver zone | Chronic liver stress | Chronic dermatitis, psoriasis tendencies |
| Radial lines through liver zone | Impaired detoxification pathways | Acne, toxin-related eruptions |
Lymphatic System Clues in Iridology Charts
The lymphatic system plays a crucial role in removing waste and toxins from tissues, directly impacting skin clarity and texture. On an iridology chart, lymphatic congestion has distinctive patterns.
Lymphatic congestion often appears on an iridology chart as cloudy or hazy areas, particularly in the outer edges of the iris. These may indicate poor waste removal from tissues, which can manifest as skin puffiness, fluid retention, or chronic skin infections. Practitioners also look for small white dots or what’s called a “lymphatic rosary,” which may suggest chronic lymphatic stress.
Step-by-Step Guide to Using an Iridology Chart
Learning to use an iridology chart for skin and detoxification assessment requires practice, but you can begin with these fundamental steps:

- Gather your materials: You’ll need a good quality iridology chart, a magnifying glass, and ideally, a way to take clear photos of your iris (a smartphone with good camera capabilities can work).
- Capture clear iris images: In natural daylight, take close-up photos of both your left and right irises. Ensure good lighting and try to capture the iris detail without glare.
- Orient your iridology chart: Remember that the chart is typically viewed as if you’re looking at someone else’s eye, so you’ll need to mirror your own iris photos accordingly.
- Begin with major zones: Start by identifying the major organ zones on the iridology chart that relate to skin health: liver, kidneys, adrenals, digestive system, and lymphatic system.
- Look for notable markings: Compare your iris to the chart, noting any dark spots, white marks, rings, or discolorations in the key zones.
- Record your observations: Keep a journal of what you observe, noting which zones show potential issues.
- Track changes over time: Take new photos periodically to monitor how iris signs change as you implement detoxification protocols.
Important Note: While self-assessment can provide interesting insights, proper interpretation of an iridology chart requires training and experience. Consider consulting with a qualified iridology practitioner for a comprehensive analysis.
Case Study: Skin Transformation Using Iridology Charts
To illustrate the practical application of iridology charts for skin health, consider this real-world example of how iris analysis guided a successful skin transformation.

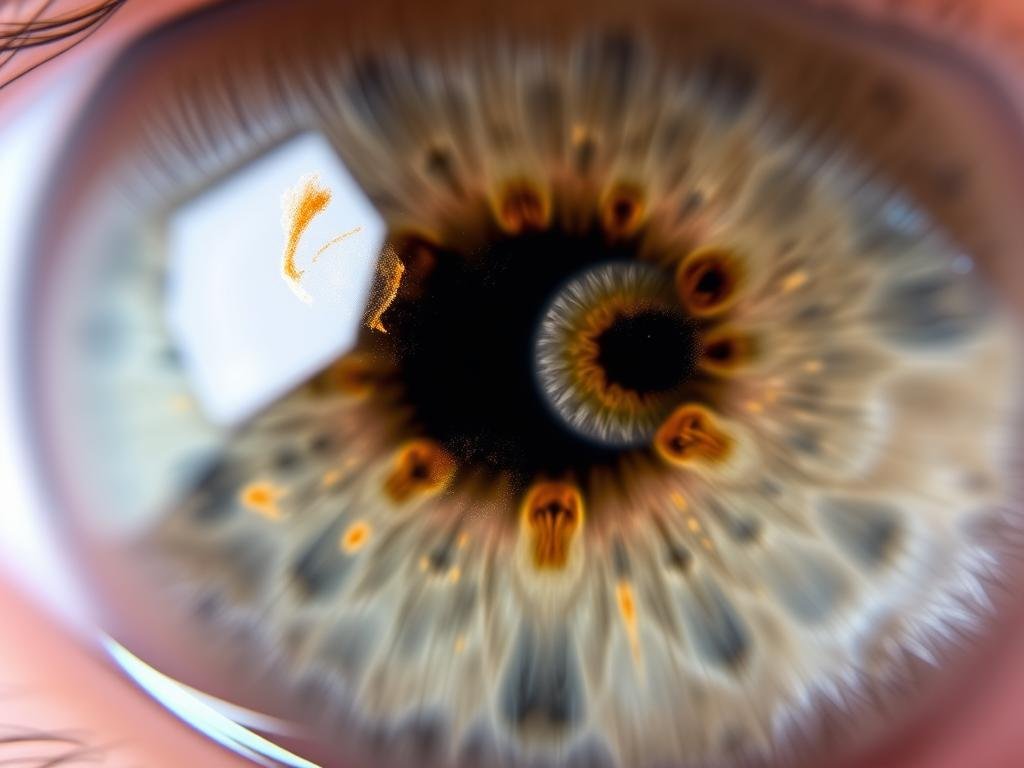
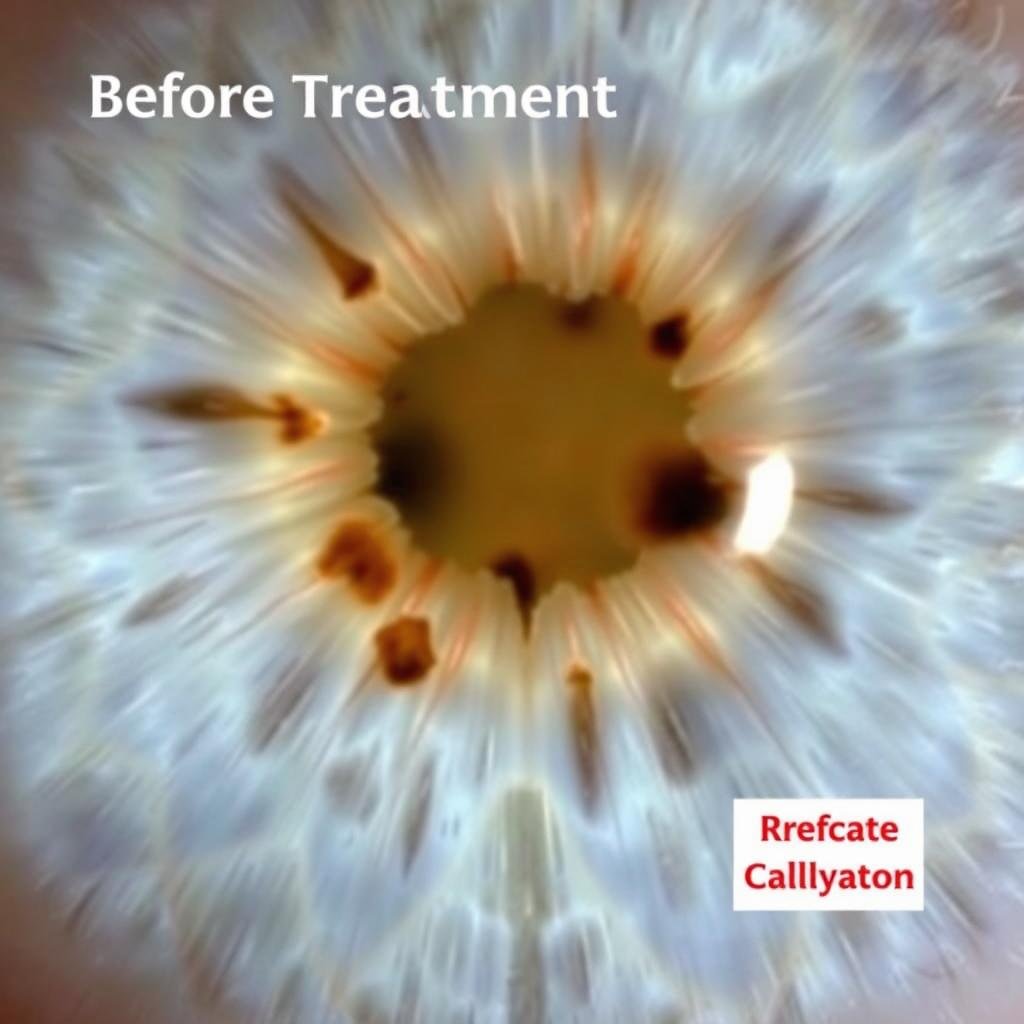
Before: Iris showing congestion markers

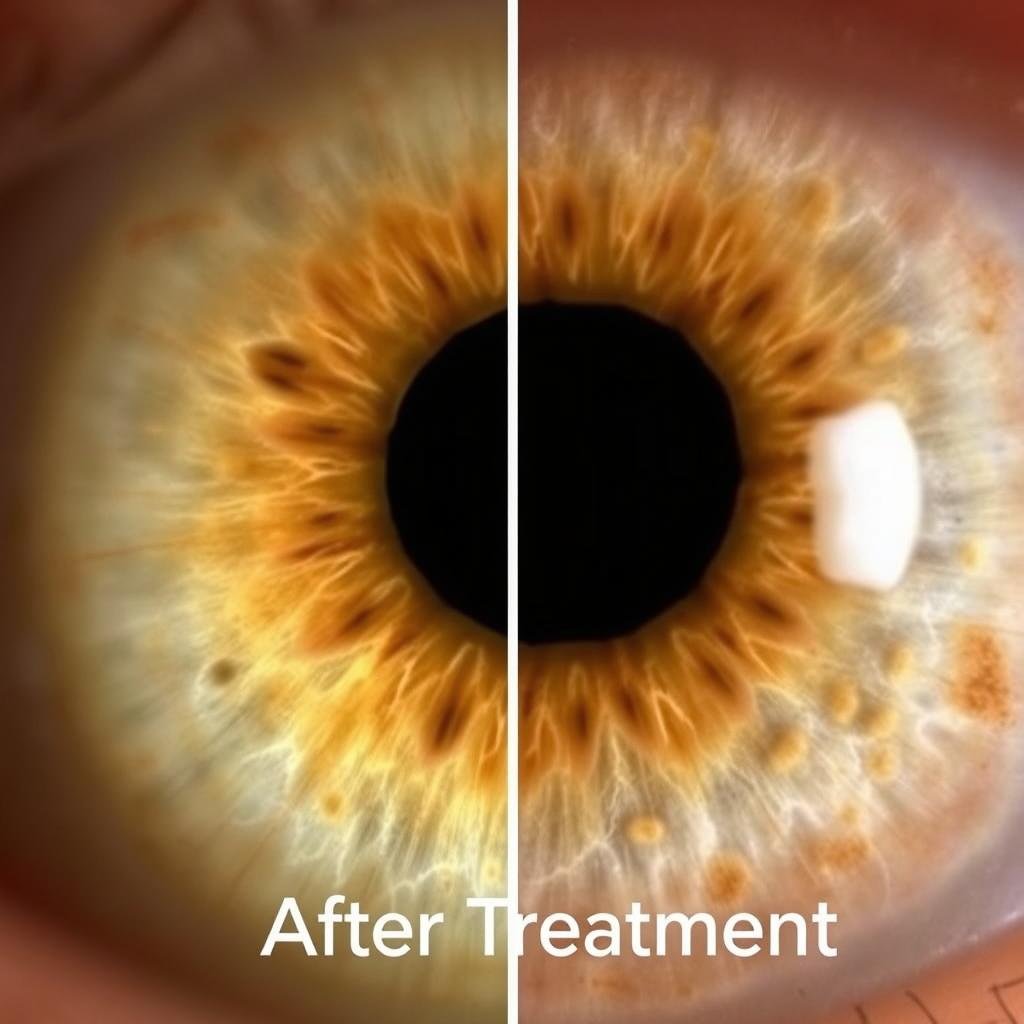
After: Improved iris clarity following protocol
Sarah, a 34-year-old client, struggled with persistent cystic acne along her jawline and chronic redness across her cheeks. Traditional dermatological approaches provided only temporary relief. An iridology assessment using a comprehensive iridology chart revealed significant congestion in her liver zone (right iris) and lymphatic system markers (both irises).
Based on these findings from the iridology chart, a targeted protocol was developed:
| Iris Finding | Protocol Component | Duration | Observed Skin Improvement |
| Liver zone congestion | Milk thistle, dandelion root, reduced alcohol and processed foods | 8 weeks | 50% reduction in jawline acne, decreased redness |
| Lymphatic stagnation markers | Dry brushing, rebounding exercise, lymphatic drainage herbs | 6 weeks | Reduced facial puffiness, improved skin texture |
| Digestive zone inflammation | Elimination diet, digestive enzymes, gut-healing protocol | 12 weeks | Significant reduction in inflammatory responses |
After three months following this protocol based on iridology chart findings, Sarah’s skin showed remarkable improvement. Follow-up iris analysis revealed clearer zones in previously congested areas, correlating with her skin improvements. This case demonstrates how targeted interventions based on iridology chart analysis can address root causes of skin issues rather than just treating symptoms.
“The most remarkable aspect was seeing how the changes in my iris paralleled improvements in my skin. As the dark spots in my iris began to clear, my complexion became noticeably brighter and clearer.”
– Sarah, Case Study Participant
Common Mistakes When Interpreting Iridology Charts
While iridology charts can provide valuable insights, there are several common misinterpretations to avoid:
Correct Approach
- Considering iris signs as indicators, not diagnoses
- Looking at patterns across multiple zones
- Tracking changes over time
- Using iridology charts as one tool among many
- Consulting with trained practitioners for complex analyses
Common Mistakes
- Diagnosing specific diseases from iris signs alone
- Focusing on isolated markings without context
- Expecting immediate iris changes after interventions
- Relying solely on iridology charts without other assessments
- Attempting complex interpretations without proper training
Remember that iris signs can be subtle and require experience to interpret correctly. What might appear as a significant marking to an untrained eye may be a normal variation, while truly important signs might be overlooked. Always use iridology charts as part of a holistic approach to health assessment.
FAQs About Iridology Charts for Detoxification
How accurate are iridology charts for identifying skin issues?
While iridology charts can provide insights into potential underlying causes of skin conditions, they should not be considered diagnostic tools. The accuracy depends on the practitioner’s skill and experience. Many holistic health practitioners find them valuable for identifying areas that may need support, but scientific validation remains limited. They work best as part of a comprehensive health assessment approach.
How long does it take to see changes in the iris after beginning a detoxification protocol?
Iris changes typically occur gradually. Minor shifts might be noticeable within 4-6 weeks of consistent detoxification efforts, but significant changes in iris patterns usually take 3-6 months to become apparent. The iris reflects long-term tissue conditions rather than immediate physiological changes. Skin improvements often become visible before iris changes can be detected.
Can I use an iridology chart for self-assessment, or do I need a professional?
While basic self-assessment using an iridology chart is possible, professional guidance is recommended for accurate interpretation. Trained iridologists have the experience to distinguish between normal iris variations and significant markers. Consider starting with self-observation to familiarize yourself with your iris patterns, then consulting with a professional for more detailed analysis and recommendations.
Do iridology charts differ for different eye colors?
Yes, interpretation can vary based on eye color. Blue or lighter-colored irises typically show markings more distinctly, while brown or darker irises may require more careful observation. Some iridology charts are specifically designed for different eye colors, with slightly different interpretation guidelines. A skilled practitioner will know how to adjust their analysis based on your specific eye color.
Ready to Discover What Your Iris Reveals?
Take the next step in understanding your body’s detoxification needs and underlying skin issues with professional guidance.
Schedule an Iridology Chart Consultation
Conclusion: Your Eyes as Windows to Skin Health
The ancient wisdom that eyes are windows to the soul might be extended to say they’re also windows to your skin’s health. Iridology charts offer a fascinating perspective on how internal imbalances may manifest as external skin conditions. While not a replacement for conventional medical care, iris analysis can provide complementary insights that help create a more comprehensive approach to addressing persistent skin issues.
By learning to use an iridology chart to identify potential areas of detoxification need, you gain another tool in your holistic health toolkit. Remember that the greatest value comes from combining multiple assessment methods and working with qualified practitioners who can help interpret what your iris reveals about your unique health journey.
Whether you’re dealing with chronic acne, mysterious rashes, or simply want to optimize your skin’s appearance, exploring the connections between your iris patterns and your skin health may open new pathways to lasting improvement.


