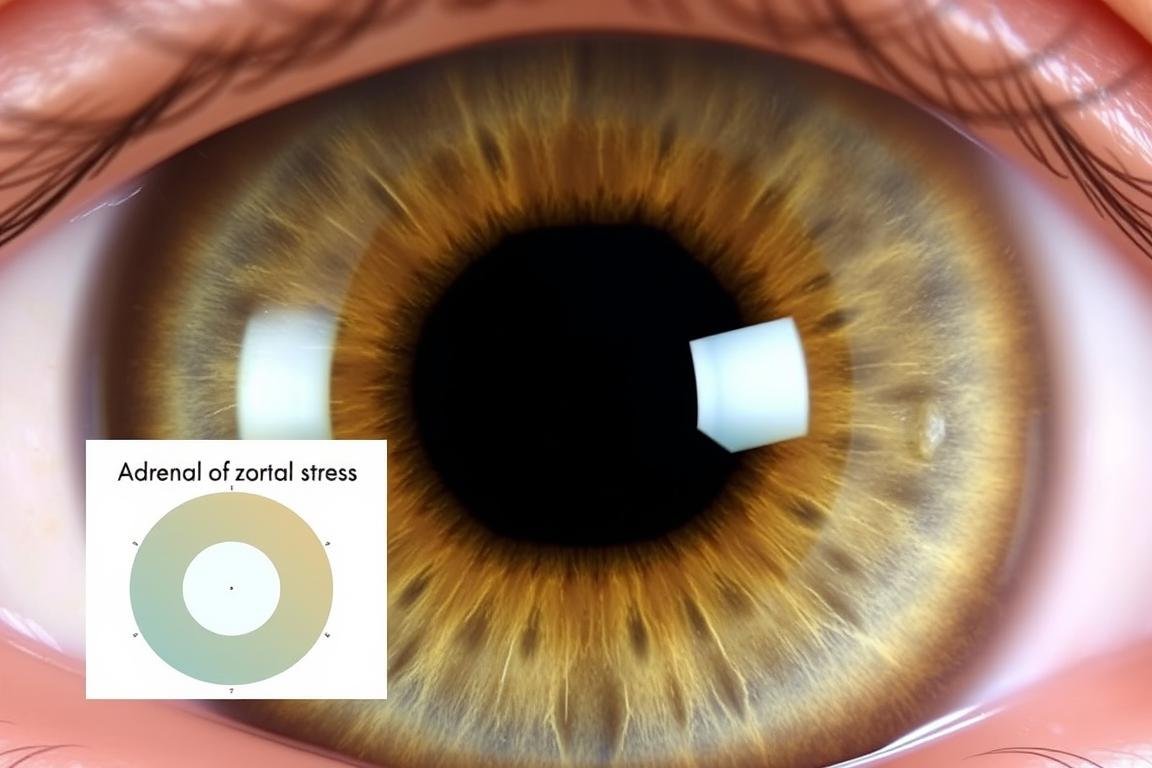
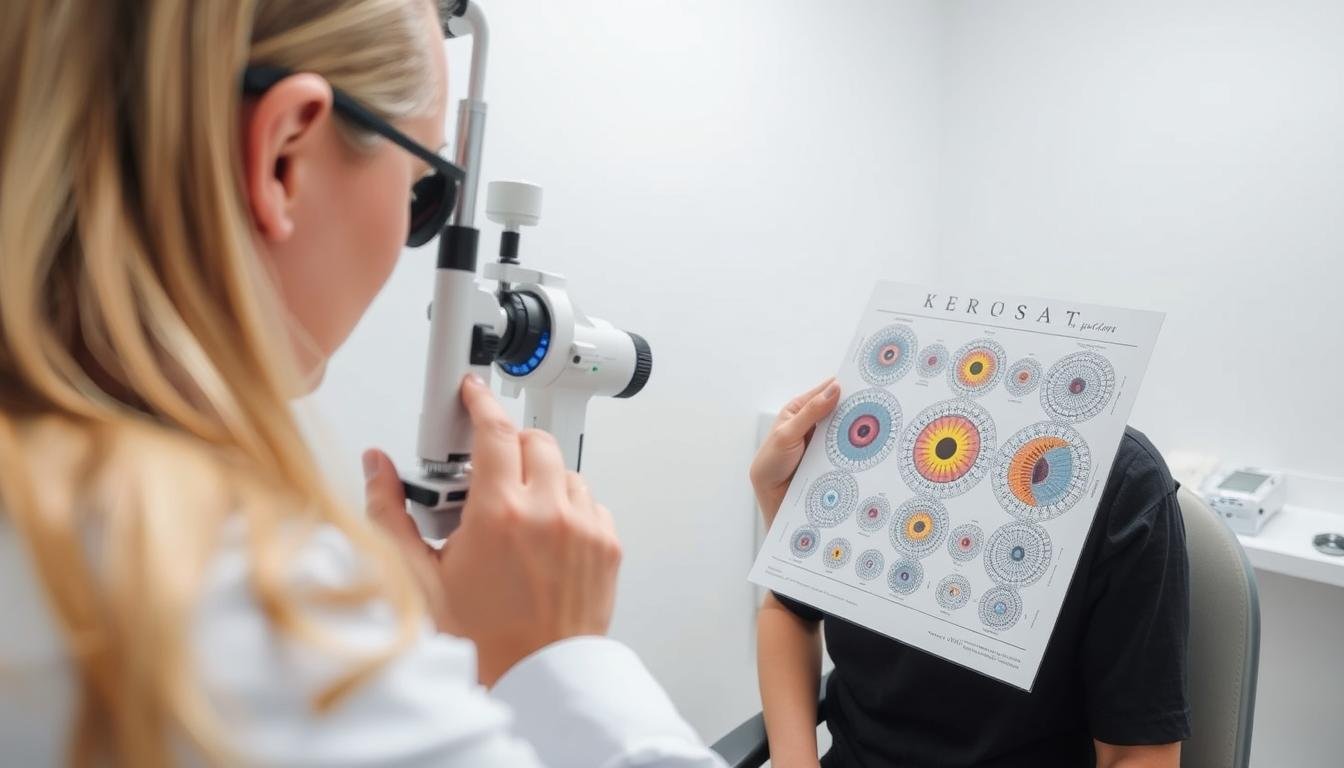
The human iris contains remarkable details that may reveal insights about our overall health. For centuries, practitioners have studied these intricate patterns using an Gráfico de Iridologia to identify potential health concerns, including hormonal imbalances. This ancient practice has gained renewed interest as people seek complementary approaches to understanding their body’s signals. In this comprehensive guide, we’ll explore how iridology charts can potentially indicate hormonal issues and what specific markers to look for in your own iris.


What Is an Iridology Chart?
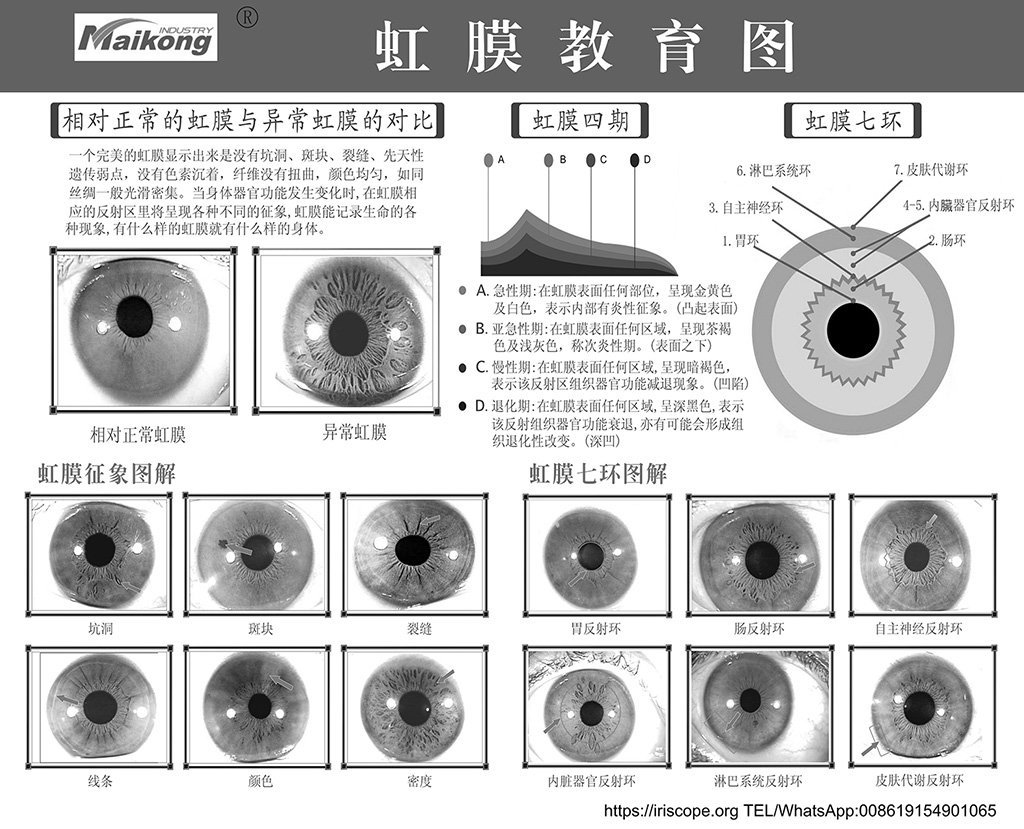
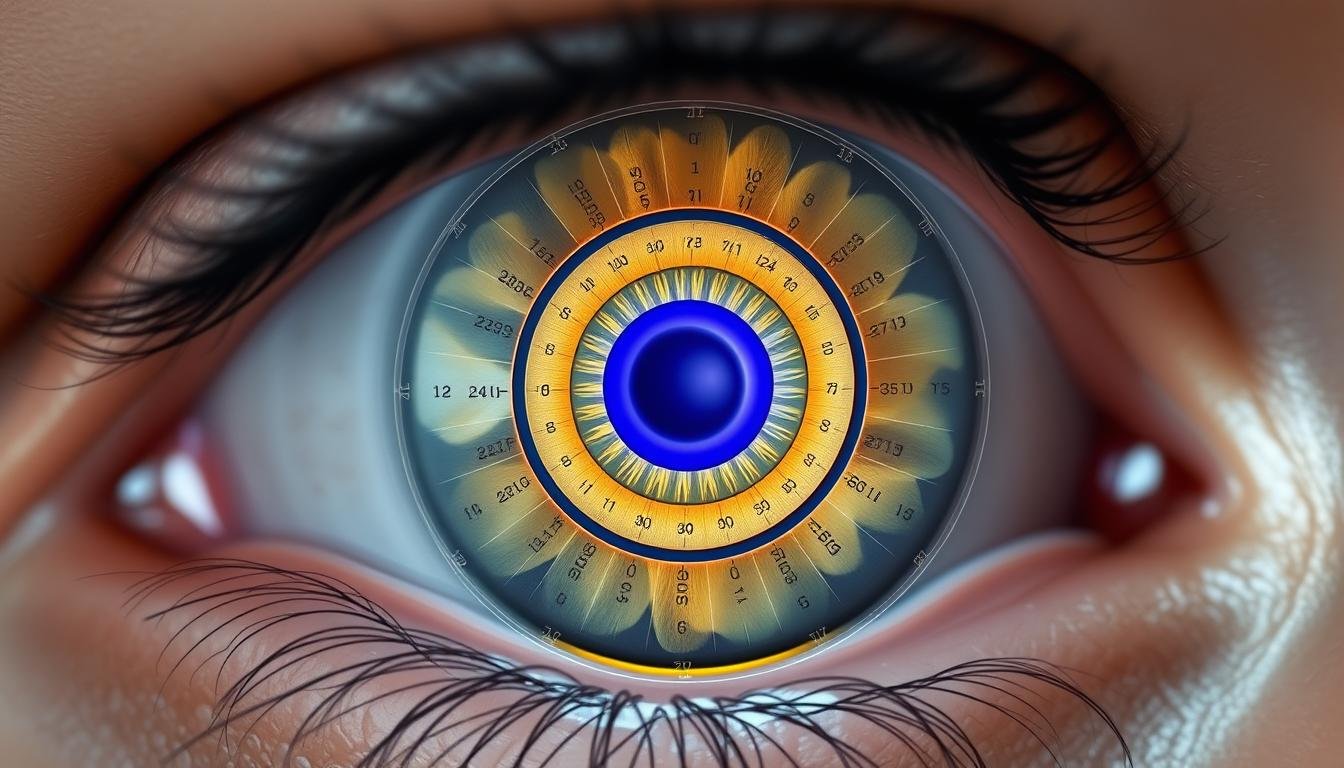
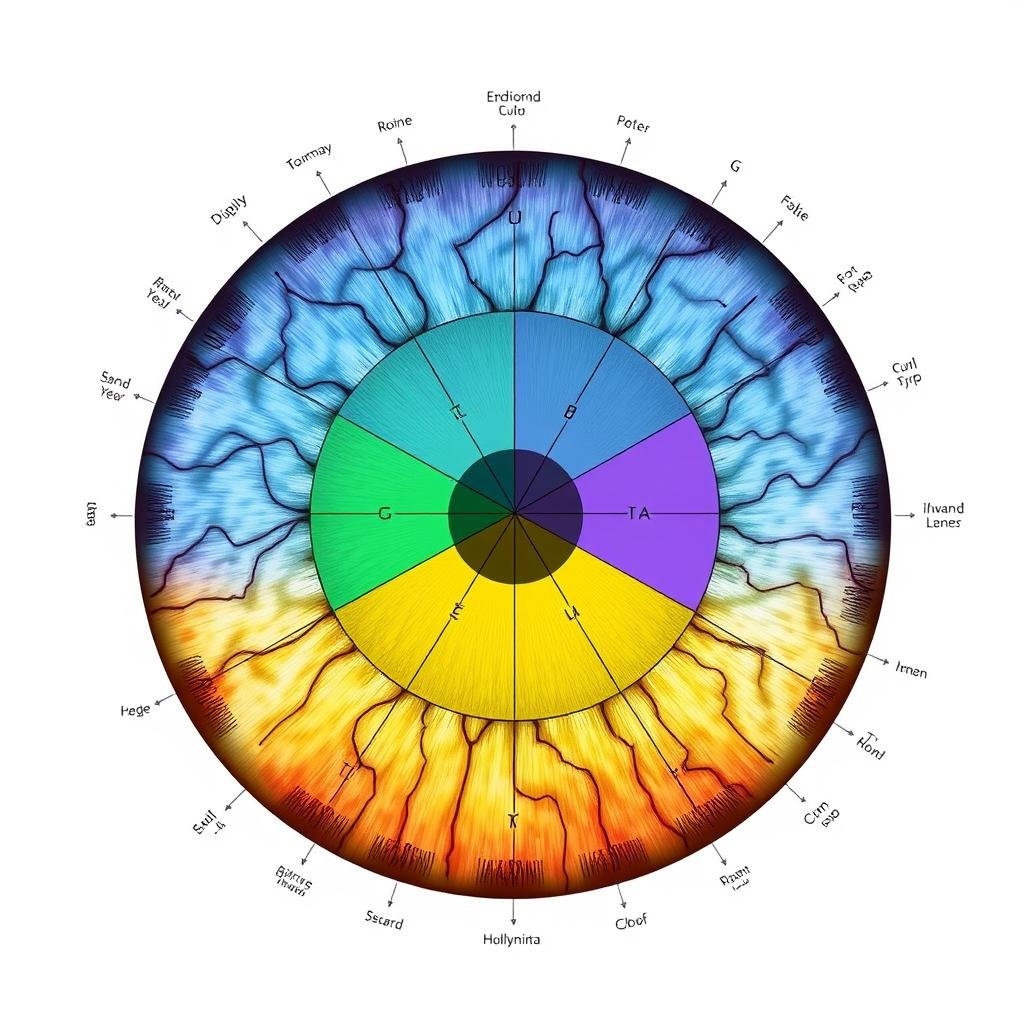
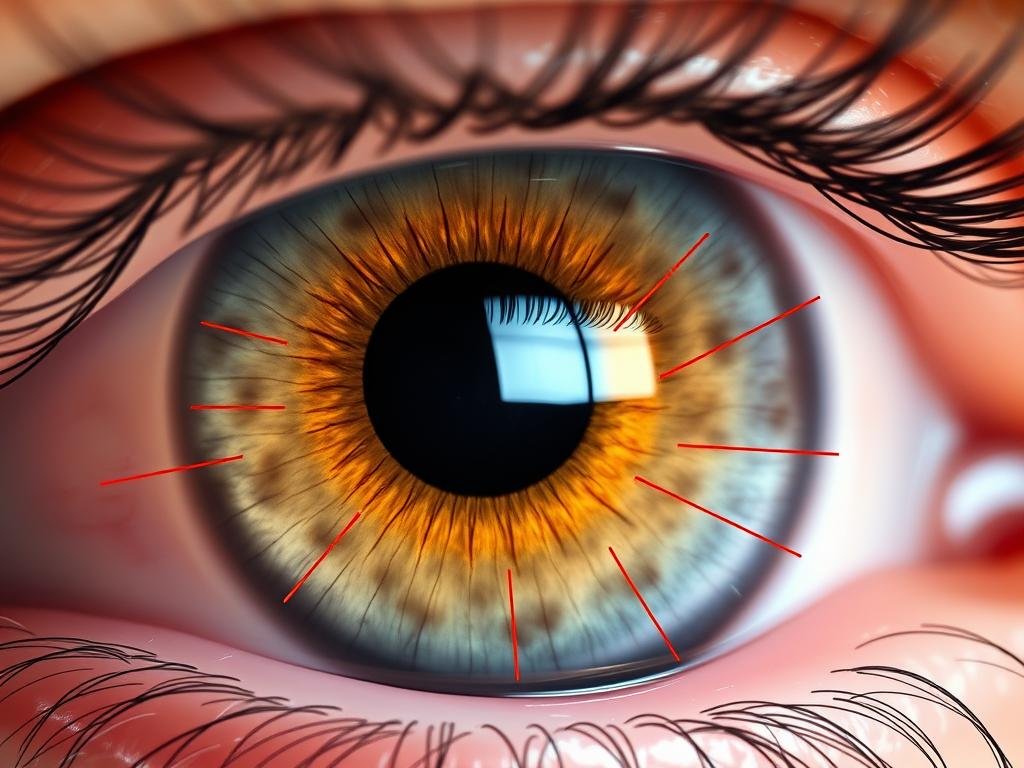
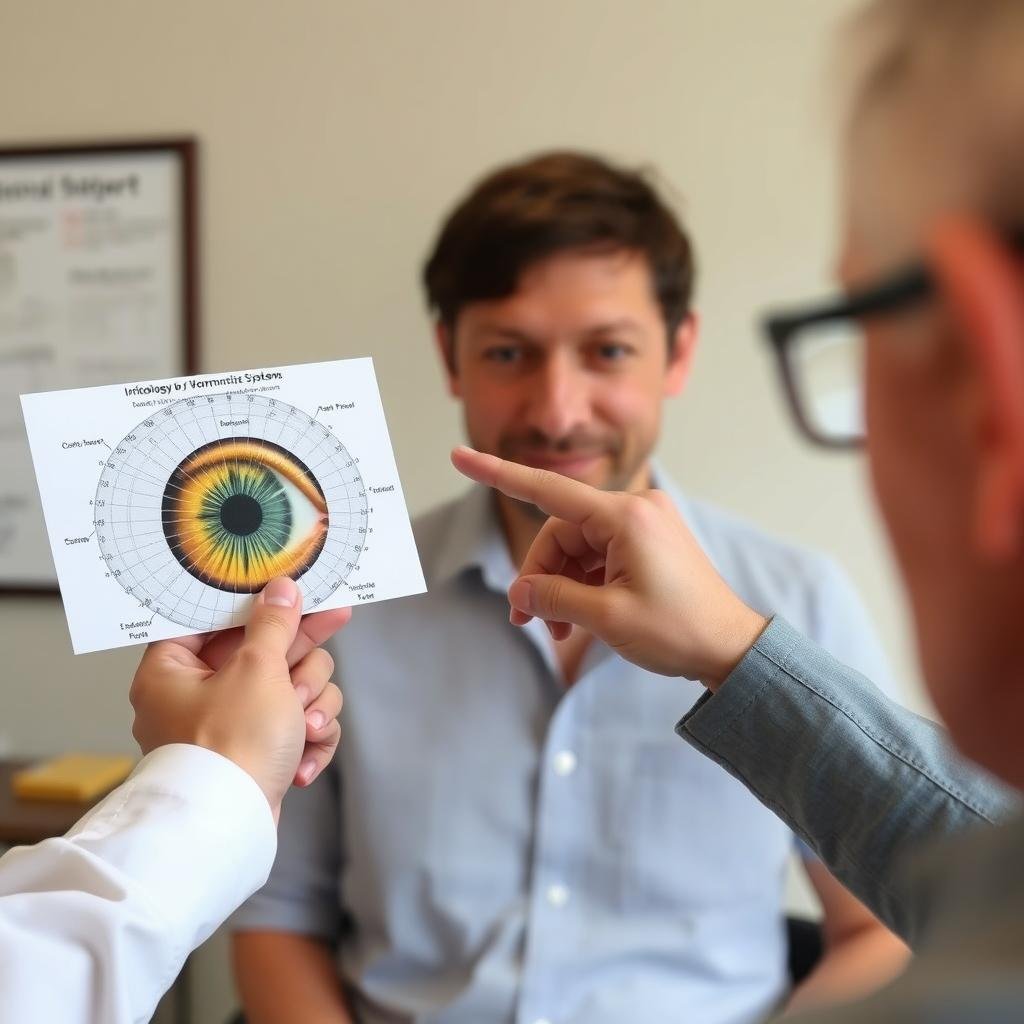
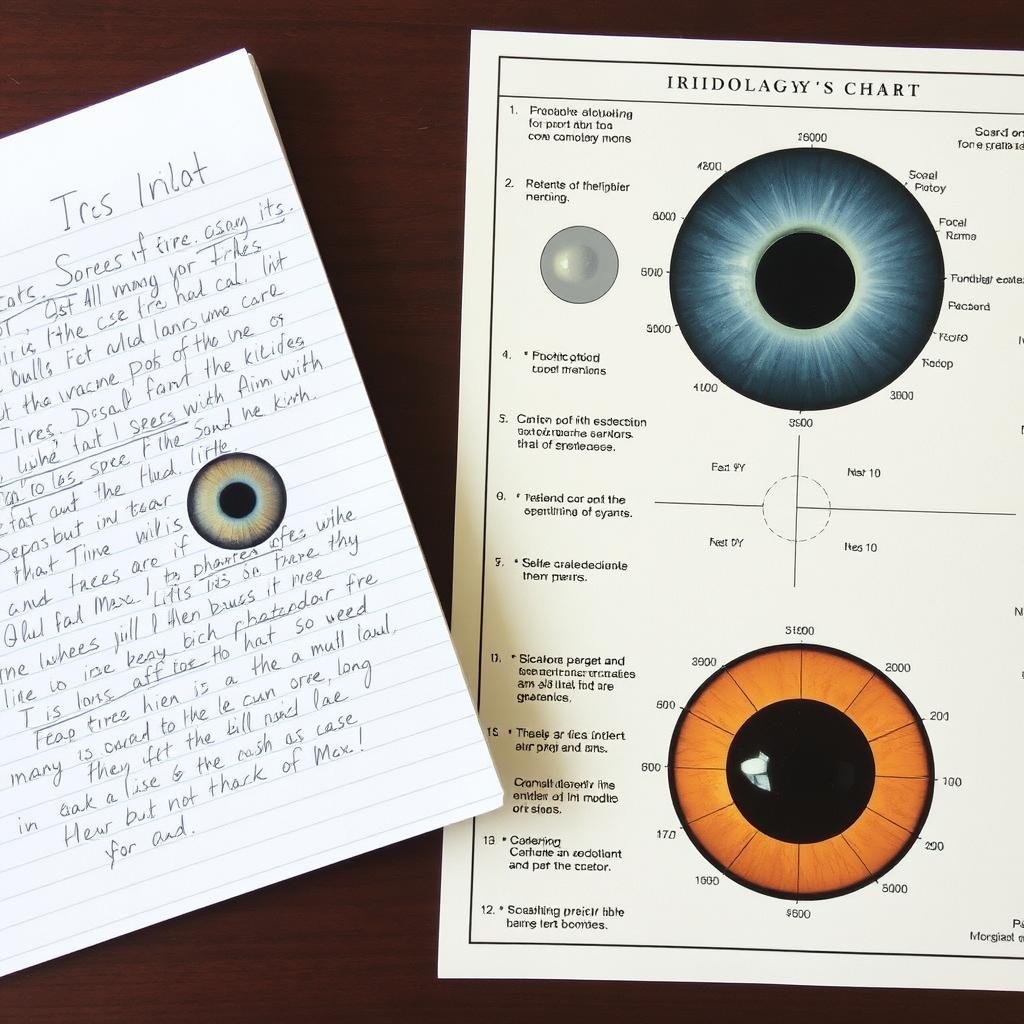
An Iridology Chart is a detailed map that divides the iris—the colored part of your eye—into zones corresponding to different organs and systems within the body. Practitioners use these charts as reference tools to analyze patterns, colors, and markings in the iris that may indicate health conditions or predispositions.
The fundamental principle behind iridology is that the iris connects to every organ and tissue via the nervous system and displays changes in these structures through alterations in iris fibers. Each iris is divided into approximately 80-90 zones, creating a complex map that iridologists interpret through careful examination.
Most Iridology Chart systems divide the iris into several main regions:
- The right iris typically corresponds to the right side of the body
- The left iris typically corresponds to the left side of the body
- The top regions often relate to the brain and head
- Middle zones frequently connect to digestive organs
- Lower regions commonly associate with elimination systems and reproductive organs
Of particular interest for hormonal health are the zones that correspond to the endocrine system—the network of glands that produce and secrete hormones throughout the body. These areas include zones linked to the thyroid, adrenals, pituitary, and reproductive organs.
Get Your Free Iridology Chart Reference Guide
Download our comprehensive iridology reference chart to begin identifying potential health indicators in your own iris. This detailed guide includes specific markers for hormonal imbalances.
Baixe o gráfico gratuito
The Science Behind Iridology Chart Analysis
While iridology has historical roots dating back to the 17th century, its scientific standing remains controversial in modern medicine. The practice gained prominence in the 1950s when Dr. Bernard Jensen developed comprehensive Iridology Chart systems that are still widely used today.
It’s important to note that conventional medicine does not currently recognize iridology as a diagnostic tool due to limited clinical evidence supporting its efficacy. However, many complementary and alternative medicine practitioners find value in using iridology as part of a holistic health assessment.
How Iridologists Use the Iridology Chart
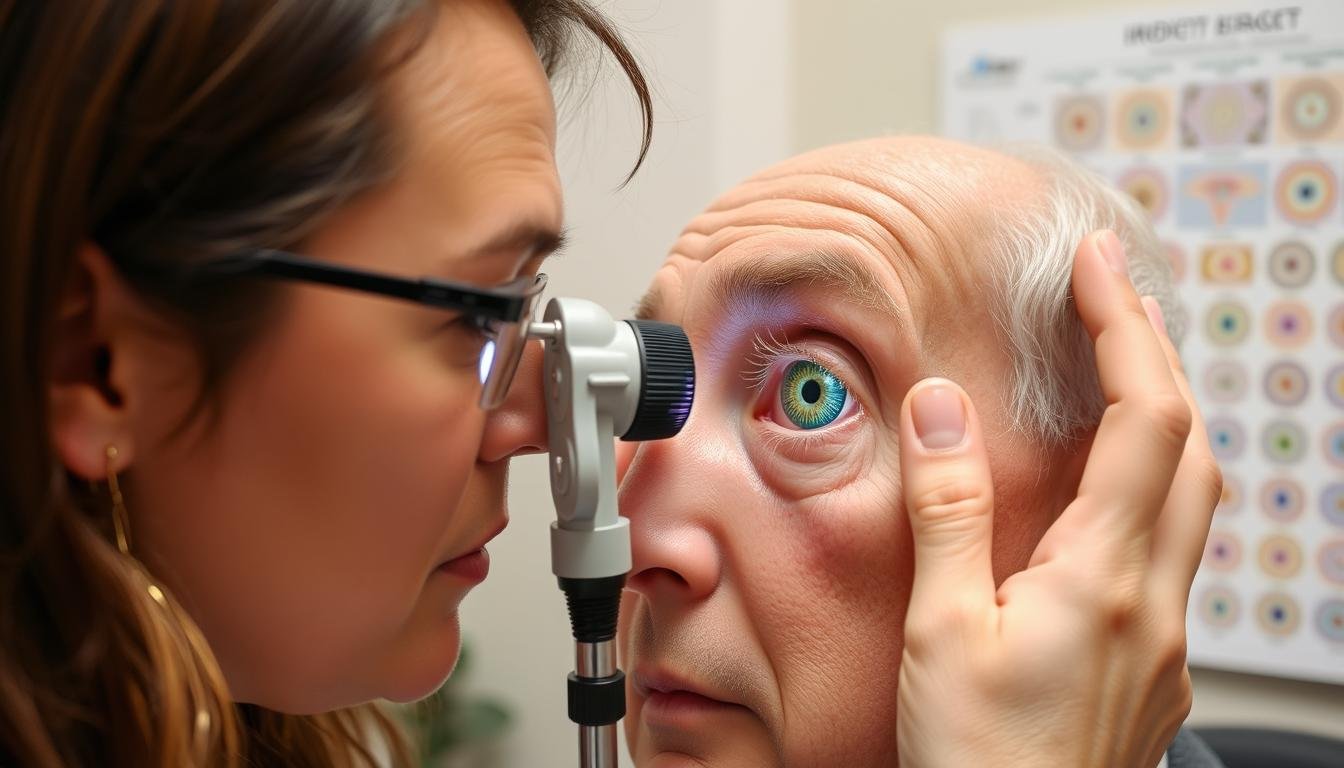
Practitioners typically follow a systematic approach when analyzing the iris:
- Examine the overall iris color, structure, and fiber patterns
- Identify specific markings, discolorations, or unusual features
- Compare findings to an Iridology Chart to determine corresponding body regions
- Assess the significance of markings based on their appearance and location
- Develop a comprehensive assessment of potential health tendencies
For hormonal analysis specifically, iridologists pay special attention to zones corresponding to the endocrine glands, looking for signs that may indicate imbalances or dysfunction.

Iridology Chart Indicators for Hormonal Imbalances
According to iridology practitioners, specific markings and patterns in the iris may correlate with hormonal imbalances. While these associations aren’t clinically proven, many alternative health practitioners report consistent patterns among patients with confirmed hormonal issues.
Common Iridology Chart Markers Linked to Endocrine Health
| Recurso da íris | Location on Iridology Chart | Potential Hormonal Indication |
| Dark rings around iris | Outer iris edge | Adrenal fatigue or stress |
| White/yellowish spots | Thyroid zone (upper quadrant) | Thyroid dysfunction |
| Linhas radiais | Reproductive zones (lower iris) | Reproductive hormone imbalance |
| Orange pigmentation | Pancreatic zone | Blood sugar regulation issues |
| Darkened areas | Pituitary zone (brain area) | Master gland imbalances |
It’s worth noting that these indicators should be considered as potential signals rather than definitive diagnoses. Many iridologists recommend using these observations as starting points for further investigation through conventional medical testing.

How to Interpret Your Iridology Chart
While professional iridologists undergo extensive training to interpret iris signs accurately, you can begin to understand some basic principles of your own iris analysis using an Iridology Chart as reference.
Step 1: Photograph Your Iris
Use a high-resolution camera in natural light to capture clear images of both your left and right irises. Ensure good lighting and focus to reveal detailed patterns.

Step 2: Compare to Chart
Using a standard Iridology Chart, identify the zones corresponding to hormonal glands (thyroid, adrenals, reproductive organs, etc.) and examine these areas in your iris photos.

Step 3: Note Unusual Markings
Look for discolorations, spots, rings, or lines in the hormonal zones of your iris and record your observations for discussion with a health practitioner.

Remember that self-analysis should never replace professional medical advice. Iridology is best used as a complementary tool alongside conventional healthcare approaches.
Validating Iridology Chart Findings with Modern Medicine
If you notice potential hormonal indicators in your iris, consider the following steps:
- Consult with a healthcare provider about appropriate hormone testing
- Track physical symptoms that may correlate with potential iris findings
- Consider working with both conventional and complementary practitioners
- Use iris observations as conversation starters with your healthcare team
Need Help Interpreting Your Iris Signs?
Our certified iridologists can provide personalized analysis of your iris patterns and potential hormonal indicators. Schedule a consultation today.
Reserve uma consulta
Case Studies: Iridology Chart and Hormone Regulation
While anecdotal, the following case examples illustrate how some practitioners have used Iridology Chart analysis alongside conventional methods to address hormonal concerns.
Case Study 1: Thyroid Function
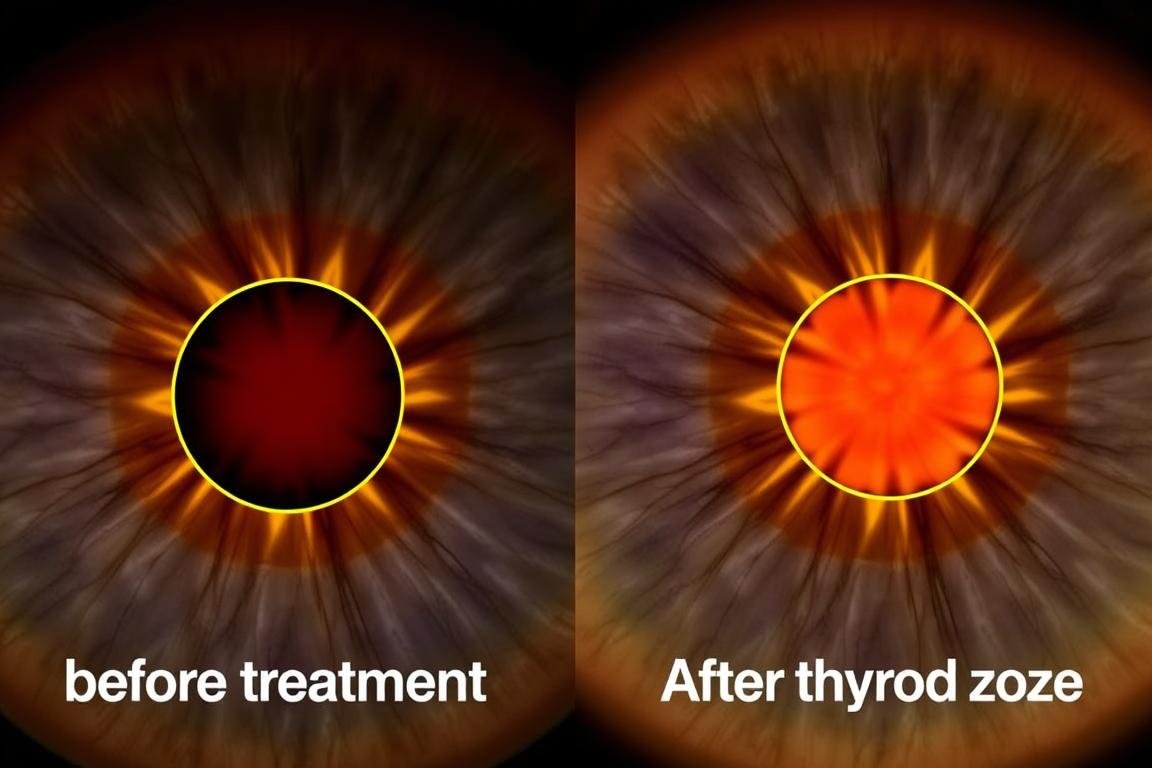
A 42-year-old woman presented with fatigue, weight gain, and hair loss. Iris analysis revealed yellowish discolorations in the thyroid zone (11 o’clock position in the right iris). Subsequent blood tests confirmed hypothyroidism. After treatment, follow-up iris photographs showed subtle changes in the thyroid zone as symptoms improved.

Case Study 2: Adrenal Stress
A 35-year-old man with chronic stress and insomnia showed prominent dark rings around both irises, corresponding to the adrenal zone on the Iridology Chart. Cortisol testing revealed abnormal patterns. After implementing stress management techniques and adrenal support supplements, both symptoms and iris appearance showed improvement over six months.

These cases suggest potential correlations between iris signs and hormonal conditions, though more research is needed to establish definitive connections. Many practitioners find value in using iridology as one component of a comprehensive health assessment.
Frequently Asked Questions About Iridology Chart Analysis
Can an Iridology Chart replace blood tests for hormones?
No, an Iridology Chart should not replace conventional hormone testing. While iridology may provide insights into potential areas of concern, laboratory tests remain the gold standard for measuring actual hormone levels. Iridology is best used as a complementary tool that may help identify areas requiring further investigation.
How accurate is iridology for detecting hormonal imbalances?
The accuracy of iridology remains controversial in scientific literature. While some practitioners report consistent correlations between iris signs and confirmed health conditions, clinical studies have shown mixed results. Iridology is best viewed as one piece of a larger health assessment rather than a definitive diagnostic tool.
Com que frequência a análise da íris deve ser realizada?
Most iridologists recommend baseline analysis followed by periodic reviews every 6-12 months. Significant changes in iris appearance typically occur slowly, reflecting long-term health patterns rather than acute conditions. More frequent analysis may be recommended when actively addressing specific health concerns.
Can I learn to read my own iris using an Iridology Chart?
While you can learn basic principles of iridology for self-observation, professional training is recommended for accurate interpretation. Many subtle iris signs require experienced analysis. Self-assessment can be a starting point for health awareness but should be confirmed by trained practitioners.

Embracing the Insights of Iridology Chart Analysis
The study of iris patterns through Iridology Chart analysis offers a fascinating window into potential health patterns, including hormonal balance. While the scientific community continues to debate its validity, many individuals find value in this non-invasive approach as part of a comprehensive health strategy.
Whether you’re curious about alternative health perspectives or seeking complementary approaches to understanding hormonal health, iridology provides a unique lens through which to view the body’s interconnected systems. As with any health approach, the greatest benefits come from combining multiple perspectives—conventional medical testing, symptom awareness, and possibly complementary methods like iridology—to create a complete picture of your health.
Comece sua jornada de iridologia hoje
Download our comprehensive Iridology Chart and guide to start exploring the potential health insights your iris may reveal. For personalized analysis, our certified iridologists are available for in-depth consultations.

