Verständnis von Iris -Diagrammen: Definition und Struktur

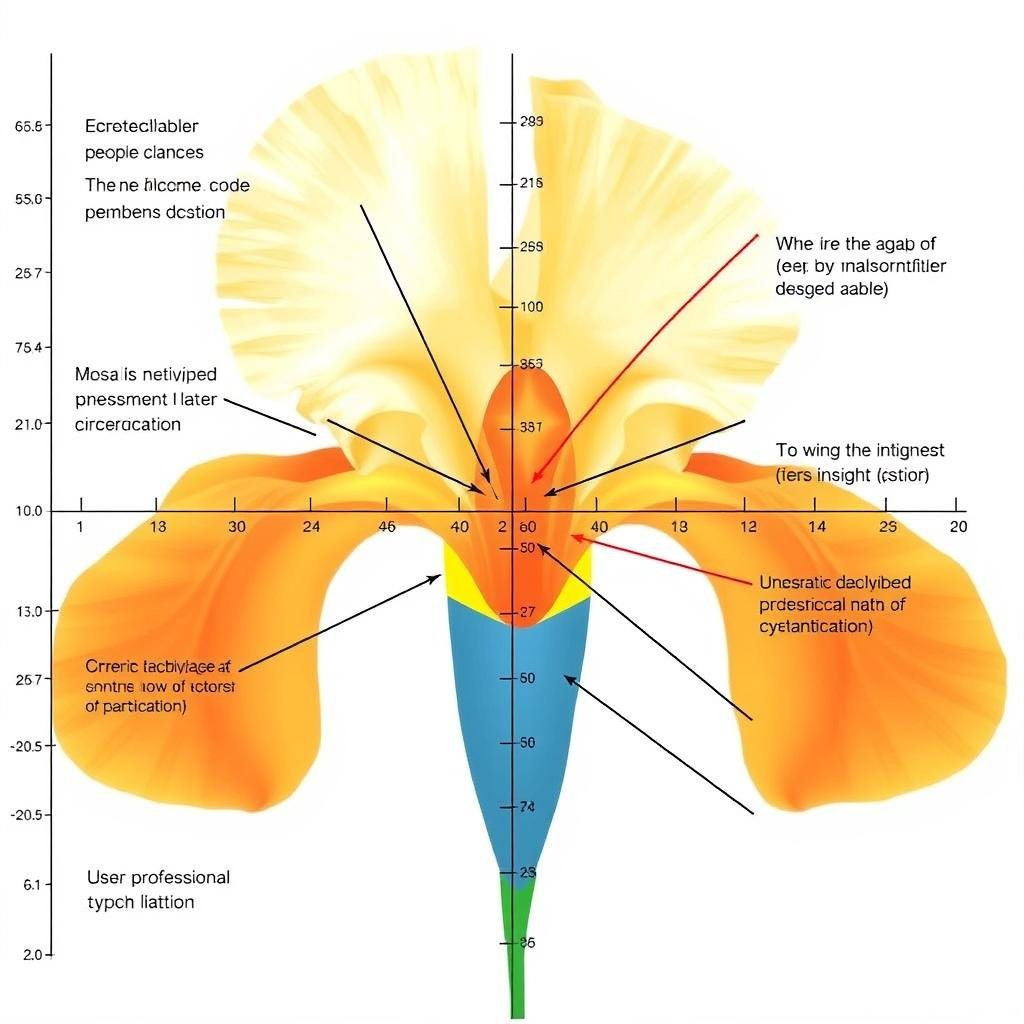
Grundstruktur eines Iris -Diagramms, das Radialachsen und Datensegmentierung zeigt
Ein IRIS -Diagramm (manchmal als radiales Diagramm oder Polarflächendiagramm bezeichnet) ist eine kreisförmige Visualisierungsmethode, die multivariate Daten entlang mehrerer Achsen zeigt, die sich von einem zentralen Punkt erstrecken. Jede Achse stellt eine andere Variable dar, wobei Datenpunkte entlang dieser Achsen aufgezeichnet und mit geschlossenen Formen verbunden sind. Die resultierende Visualisierung ähnelt einer Iris, daher dem Namen.
Die grundlegende Struktur eines Iris -Diagramms umfasst:
- Ein zentraler Ursprungspunkt, von dem alle Achsen ausstrahlen
- Mehrere radiale Achsen, die verschiedene Variablen darstellen
- Datenpunkte, die entlang jeder Achse nach ihren Werten aufgetragen wurden
- Verbundene Linien oder ausgefüllte Bereiche zwischen Datenpunkten
- Optionale Farbcodierung zur Darstellung zusätzlicher Dimensionen
IRIS -Diagramme zeichnen sich hervorragend zum Aufdecken von Mustern, Ausreißern und Beziehungen über mehrere Dimensionen hinweg gleichzeitig. Ihre radiale Natur macht sie besonders effektiv für zyklische Daten, vergleichende Analysen und Situationen, in denen traditionelle Diagramme möglicherweise Schwierigkeiten haben, komplexe Beziehungen klar zu zeigen.
Reale Anwendungen von Iris-Charts
IRIS -Diagramme haben Anwendungen in zahlreichen Bereichen gefunden, da die multivariate Datenvisualisierung effektiv verarbeitet werden kann. Hier sind drei überzeugende Beispiele für Iris -Diagramme in Aktion:
1. Data Science: Fisher's Iris -Datensatzvisualisierung von Fisher

IRIS -Diagramm Visualisierung des berühmten Iris -Datensatzes von Fisher, in dem drei Arten verglichen werden
Die vielleicht am besten geeignete Anwendung, Fisher's Iris -Datensatz (das zufällig den Namen teilt) wird häufig mit IRIS -Diagrammen visualisiert. Dieser berühmte Datensatz enthält Messungen von vier Merkmalen (Sepallänge, Sepalbreite, Blütenblattlänge, Blütenbreite) für drei Iris -Arten. In einem Iris -Diagramm werden alle vier Dimensionen gleichzeitig gezeigt, sodass es einfach ist, die verschiedenen Arten zu vergleichen und Unterscheidungsmerkmale durch Datensegmentierungsmuster zu identifizieren.
2. Leistungsmetriken in der Geschäftsanalyse

Business Performance Iris -Diagramm zeigt KPIs in mehreren Abteilungen in mehreren Abteilungen
Unternehmen verwenden Iris -Diagramme, um wichtige Leistungsindikatoren in mehreren Abteilungen oder Geschäftseinheiten zu verfolgen. Jede Achse stellt eine andere Metrik dar (Umsatzwachstum, Kundenzufriedenheit, betriebliche Effizienz usw.), wodurch Führungskräfte Bereiche mit Stärke und Schwäche schnell identifizieren können. Die radiale Visualisierung macht es für vierteljährliche oder jährliche Leistungsüberprüfungen besonders effektiv und ermöglicht eine multivariate Analyse auf einen Blick.
3.. Biologische und medizinische Forschung

IRIS -Diagramm zeigen Genexpressionsmuster über verschiedene Gewebeproben hinweg
In der Genomik und medizinischen Forschung helfen IRIS -Diagramme dazu, komplexe biologische Daten wie Genexpressionsmuster in verschiedenen Gewebeproben oder Patientengruppen zu visualisieren. Das radiale Format ermöglicht es Forschern, mehrere Gene oder Biomarker gleichzeitig zu zeichnen und Cluster und Korrelationen zu enthüllen, die in traditionellen Visualisierungen möglicherweise nicht erkennbar sind. Diese Anwendung zeigt die Leistung des Iris-Diagramms bei der Behandlung hochdimensionaler biologischer Datensätze.
Diese Beispiele unterstreichen die Vielseitigkeit von Iris -Diagrammen über verschiedene Bereiche hinweg. Ihre Fähigkeit, eine multivariate Analyse zu bewältigen, macht sie zu wertvollen Instrumenten für die datengesteuerte Entscheidungsfindung sowohl in wissenschaftlichen als auch in geschäftlichen Kontexten.
Erstellen eines Iris -Diagramms mit Python und Matplotlib
Folgen Sie diesem Schritt-für-Schritt-Tutorial, um Ihr eigenes Iris-Diagramm mit Python und der beliebten Matplotlib-Bibliothek zu erstellen. Wir werden Fisher's Iris -Datensatz als Beispiel verwenden, um den Prozess zu demonstrieren.

Python -Code und resultierende IRIS -Diagramm -Visualisierung
Schritt 1: Richten Sie Ihre Umgebung ein
Stellen Sie zunächst sicher, dass die erforderlichen Bibliotheken installiert sind. Sie benötigen Numpy, Pandas und Matplotlib. Wenn Sie sie noch nicht haben, installieren Sie sie mit PIP:
pip install numpy pandas matplotlib
Schritt 2: Bibliotheken importieren und Daten laden
Importieren Sie nun die erforderlichen Bibliotheken und laden Sie den IRIS -Datensatz:
import numpy as np

import pandas as pd

import matplotlib.pyplot as plt

from sklearn.datasets import load_iris
iris = load_iris ()
df = pd.dataframe (data = iris.data, columns = iris.feature_names)
DF [„Spezies“] = iris.target
DF ["Spezies"] = df ["spezies"]. map ({0: "setosa", 1: "Versicolor", 2: "Virginica"})
Schritt 3: Bereiten Sie Daten für das Iris -Diagramm vor
Berechnen Sie die Durchschnittswerte für jedes Merkmal nach Arten, um unser Iris -Diagramm zu erstellen:
# Calculate mean values for each feature by species

means = df.groupby('species').mean()
# Feature -Namen und Anzahl der Funktionen abrufen
features = iris.feature_names
Num_Features = len (Merkmale)
# Richten Sie die Winkel für jedes Merkmal ein (teilen Sie den Kreis gleichmäßig auf)
Angles = Np.Linspace (0, 2*np.pi, num_Features, Endpoint = false) .tolist ()
Winkel += Winkel [: 1]
setosa = messine.loc ['setosa']. values.tolist ()
Sen = seidig [: 1]
versicolor = messine.loc ['versicolor']. values.tolist ()
Versicolor += Versicolor [: 1]
Virginica = Means.loc ['Virginica']. Werte.tolist ()
Virginica += Virginica [: 1]
Labels = Funktionen
Labels += Labels [: 1]
Schritt 4: Erstellen Sie das Iris -Diagramm
Lassen Sie uns nun die tatsächliche IRIS -Diagramm -Visualisierung erstellen:
# Create the plot

fig, ax = plt.subplots(figsize=(10, 10), subplot_kw=dict(polar=True))
# Zieh jede Art
Ax.Plot (Winkel, Setosa, "O-", Linewidth = 2, label = "setosa", color = "blau")
Ax.Fill (Winkel, Setosa, Alpha = 0,25, Color = 'Blue')
Ax.Plot (Winkel, Versicolor, „O-“, Linewidth = 2, Label = “Versicolor, Color = 'Green')
Ax.Fill (Winkel, Versicolor, Alpha = 0,25, Color = 'Green')
Ax.Fill (Winkel, Virginica, Alpha = 0,25, Color = 'Red')
ax.set_xticks (Winkel [:-1])
ax.set_xticklabels (Labels [:-1])
PLT.TITLE ("Iris -Datensatz – Merkmalsvergleich nach Arten, Größe = 15)
PLT.LEGEND (loc = 'oben rechts')
Plt.TIGHT_LAYOUT ()
Plt.Show ()
Schritt 5: Passen Sie Ihr Iris -Diagramm an
Sie können Ihr Iris -Diagramm weiter anpassen, indem Sie Farben, Transparenz, Linienstile und Annotationen anpassen. Hier erfahren Sie, wie Sie die Visualisierung verbessern können:
# Add grid lines and adjust their appearance

ax.grid(True, linestyle='-', alpha=0.5)
# Passen Sie die radialen Grenzen für eine bessere Visualisierung an
ax.set_ylim (0, 8)
# Fügen Sie einen Untertitel mit zusätzlichen Informationen hinzu
Ax.Text (0,5, 1,1, „Vergleich von Sepal- und Blütenblattmessungen über Arten hinweg“.
Horizontalalignment = 'Center', VerticalInignment = 'Center',
Transformation = Ax.Transaxes, fontsize = 12)
Ax.Plot (Winkel [0], setosa [0], „O“, MarkerSize = 10, Color = 'Blue')
Ax.noti ('Suspose -Sepallänge', xy = (Winkel [0], Silky [0]),
xytext = (Winkel [0] -0,2, Silky [0] +1),
ArrowProps = dict (arrowStyle = ’->’, Color = 'schwarz'))
Holen Sie sich den vollständigen Python -Code
Laden Sie das vollständige Python -Skript mit zusätzlichen Anpassungsoptionen und Beispieldatensätzen herunter.
Laden Sie den Python -Code herunter
Erstellen eines einfachen Iris -Diagramms mit HTML und CSS

HTML/CSS -Implementierung eines einfachen IRIS -Diagramms
Für Webentwickler finden Sie hier eine vereinfachte Implementierung eines IRIS -Diagramms mit HTML und CSS. Dieser Ansatz erzeugt eine statische Visualisierung, die direkt in Webseiten eingebettet werden kann:
<!-- HTML Structure -->

<div class="iris-chart-container">

<div class="iris-chart">

<div class="axis axis-1"><span>Sepal Length</span></div>

<div class="axis axis-2"><span>Sepal Width</span></div>

<div class="axis axis-3"><span>Petal Length</span></div>

<div class="axis axis-4"><span>Petal Width</span></div>

<div class="axis axis-5"><span>Symmetry</span></div>
<div class =”Datenpunktpunkt-2″ Stil =”–Wert: 0,6;”></div>
<div class =”Data-Point-Punkt-3″ Stil =”–Wert: 0,9;”></div>
<div class =”Data-Point-Punkt-4″ Stil =”–Wert: 0,7;”></div>
<div class =”Data-Point-Punkt-5″ Stil =”–Wert: 0,5;”></div>
</div>
</div>
Und das entsprechende CSS:
/* CSS Styling */

.iris-chart-container {

width: 400px;

height: 400px;

margin: 0 auto;

}
.iris-chart {
Position: Relativ;
Breite: 100%;
Höhe: 100%;
Grenzradius: 50%;
Hintergrund: #f5f5f5;
}
.AXIS {
Position: absolut;
Top: 50%;
Links: 50%;
Breite: 50%;
Höhe: 1PX;
Hintergrund: RGBA (0, 0, 0, 0,2);
Transform-Ursprung: linker Zentrum;
}
.AXIS-2 {Transform: Drehen (72DEG); }
.AXIS-3 {Transformation: rotate (144DEG); }
.AXIS-4 {Transform: Drehen (216 Grad); }
.AXIS-5 {Transform: Drehen (288 Grad); }
Position: absolut;
Rechts: -60px;
Transformation: Drehen (90 Grad);
Transform-Ursprung: linker Zentrum;
Schriftgröße: 12px;
}
Position: absolut;
Top: 50%;
Links: 50%;
Breite: 10px;
Höhe: 10px;
Hintergrund: #3498db;
Grenzradius: 50%;
Transformation: Translate (-50%, -50%);
}
.Point-2 {Transformation: Drehen (72DEG) Translatex (Calc (var (var ()–Wert) * 180px)) drehen (-72DEG); }
.Point-3 {Transformation: Drehen (144DEG) Translatex (Calc (var (var ()–Wert) * 180px)) drehen (-144DEG); }
.Point-4 {Transformation: Drehen (216DEG) Translatex (Calc (var (var ()–Wert) * 180px)) drehen (-216deg); }
.Point-5 {Transformation: Drehen (288deg) Translatex (Calc (var (var ()–Wert) * 180px)) Drehung (-288DEG); }
Position: absolut;
Top: 50%;
Links: 50%;
Breite: 100%;
Höhe: 100%;
Clip-Pfad: Polygon (
Calc (50% + 180px * 0,8 * cos (0deg)) Calc (50% + 180px * 0,8 * sin (0deg)),
CALC (50% + 180px * 0,6 * cos (72 °)) CALC (50% + 180px * 0,6 * sin (72deg)),
CALC (50% + 180px * 0,9 * cos (144 °)) CALC (50% + 180px * 0,9 * sin (144 °)),
CALC (50% + 180px * 0,7 * cos (216 °)) CALC (50% + 180px * 0,7 * sin (216deg)),
Calc (50% + 180px * 0,5 * cos (288 °)) CALC (50% + 180px * 0,5 * sin (288 °))
);
Hintergrund: RGBA (52, 152, 219, 0,3);
Transformation: Translate (-50%, -50%);
}
Diese Implementierung erstellt ein grundlegendes Iris -Diagramm mit fünf Achsen. Sie können es anpassen, indem Sie die Anzahl der Achsen, Farben und Datenwerte anpassen. Für dynamische Daten müssen Sie die CSS -Werte mit JavaScript basierend auf Ihrem Datensatz generieren.
5 Best Practices für ein effektives Iris -Diagramm -Design

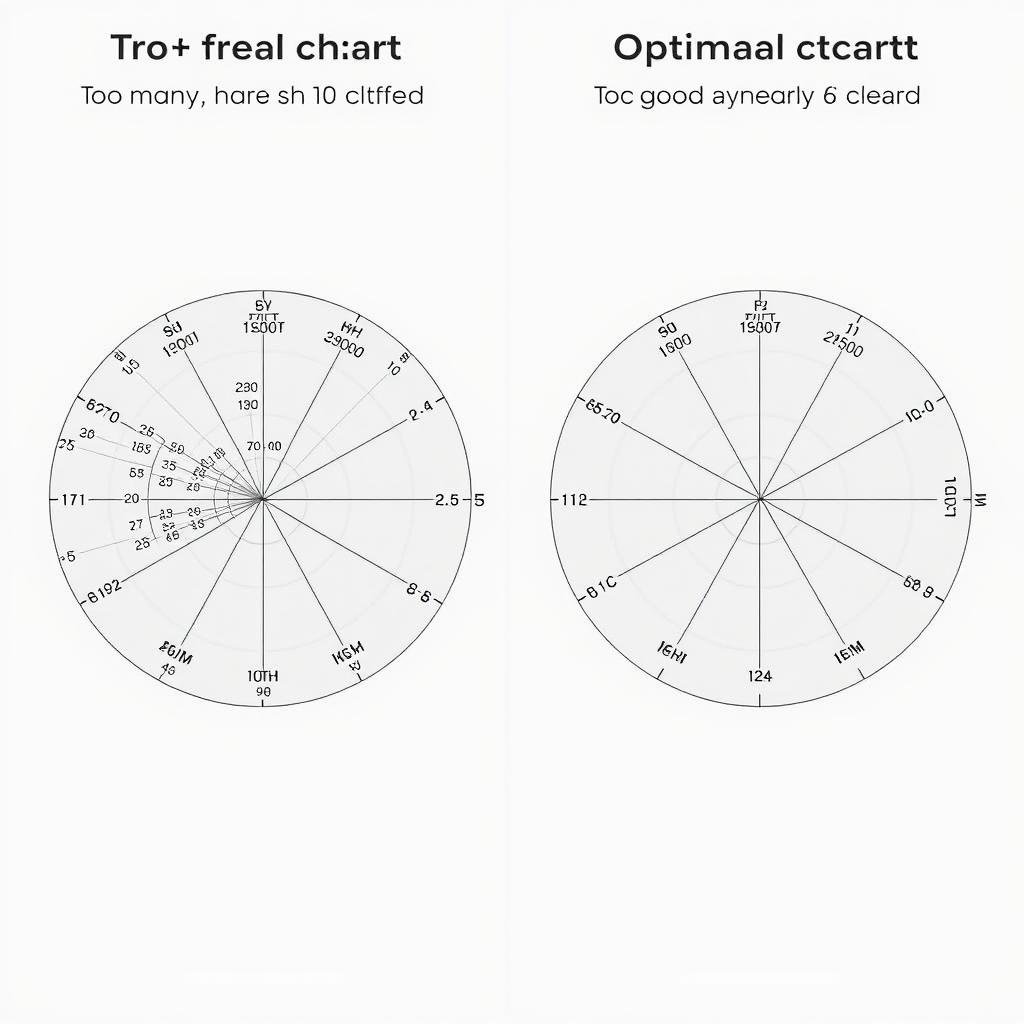
Vor und nach dem Vergleich zeigt Verbesserungen des Iris -Diagrammdesigns
1. Begrenzen Sie die Anzahl der Variablen
Während Iris-Diagramme theoretisch viele Variablen aufnehmen können, liefert sie auf 5-8 Achsen typischerweise die lesbarsten Ergebnisse. Zu viele Variablen erzeugen visuelle Unordnung und erschweren die Mustererkennung. Wenn Sie mehr Variablen haben, erstellen Sie mehrere Iris -Diagramme oder verwenden alternative Visualisierungsmethoden für einige Dimensionen.
2. Verwenden Sie konsistente Skalen
Stellen Sie sicher, dass alle Achsen eine konsistente Skalierung verwenden, um eine visuelle Verzerrung zu verhindern. Wenn Variablen unterschiedliche Einheiten oder Bereiche haben, normalisieren Sie sie auf eine gemeinsame Skala (typischerweise 0-1 oder 0-100%). Inkonsistente Skalierung kann zu irreführenden Visualisierungen führen, bei denen einige Variablen signifikanter erscheinen als tatsächlich im Verhältnis zu anderen.
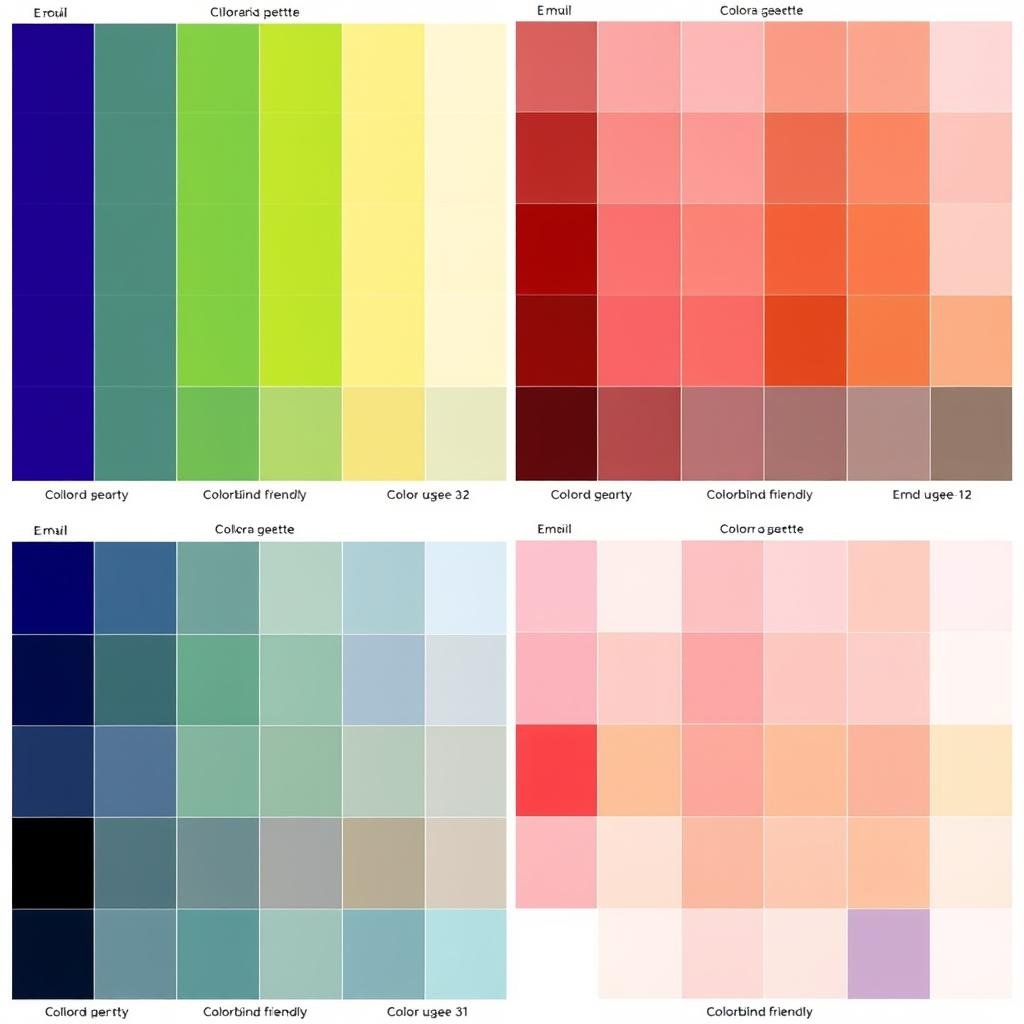
3. Wählen Sie geeignete Farbschemata
Wählen Sie Farben aus, die die Lesbarkeit verbessern und die Bedeutung vermitteln. Verwenden Sie für mehrere Datensätze im selben Iris -Diagramm kontrastierende Farben, die auch dann unterscheidbar sind, wenn Transparenz angewendet wird. Für einzelne Datensätze sollten Sie Farbgradienten verwenden, um zusätzliche Abmessungen darzustellen. Stellen Sie immer sicher, dass Ihre Farbauswahl für Farbblind -Benutzer zugänglich ist.
4. Geben Sie klare Etiketten und Legende an
Fügen Sie immer klare Achsenbezeichnungen ein, die beschreiben, was jede Variable darstellt. Positionieren Sie Etiketten, um die Überlappung zu minimieren und die Lesbarkeit zu gewährleisten. Fügen Sie für mehrere Datensätze eine umfassende Legende hinzu, die die Farbcodierung und andere visuelle Elemente erklärt. Erwägen Sie, kurze Anmerkungen hinzuzufügen, um wichtige Erkenntnisse hervorzuheben oder ungewöhnliche Muster zu erklären.
5. Kontext und Vergleiche einschließen
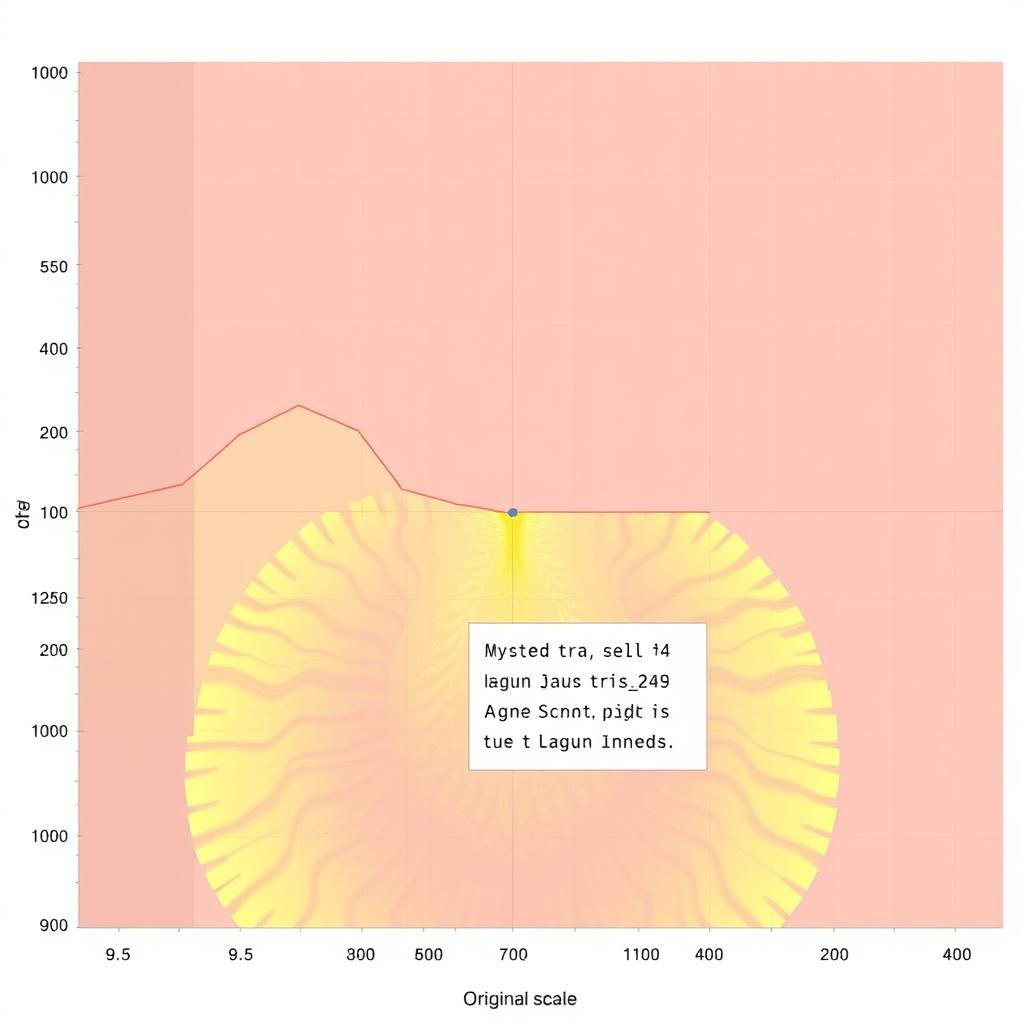
Verbessern Sie den Wert Ihres Iris -Diagramms, indem Sie einen Kontext bereitstellen. Dies kann historische Durchschnittswerte, Branchenbenchmarks oder Zielwerte umfassen, die als Referenzlinien oder Formen angezeigt werden. Vergleichende IRIS -Diagramme (vor/Nachher, tatsächliche vs. Ziel oder verschiedene Segmente) liefern häufig umsetzbarere Erkenntnisse als eigenständige Visualisierungen.

IRIS -Diagramm erhöht mit Benchmark -Vergleiche und Referenzwerten
Durch die Befolgung dieser Best Practices erstellen Sie Iris -Diagramme, die komplexe multivariate Beziehungen effektiv kommunizieren und gleichzeitig für Ihr Publikum zugänglich und aufschlussreich bleiben. Denken Sie daran, dass das ultimative Ziel Klarheit der Kommunikation ist, nicht nur die visuelle Anziehungskraft.
Schlussfolgerung: Beherrschen der Kunst der Iris -Charts
IRIS -Diagramme stellen eine leistungsstarke Ergänzung Ihres Datenvisualisierungs -Toolkits dar, insbesondere bei der multivariaten Analyse und der komplexen Datensegmentierung. Ihre einzigartige radiale Struktur ermöglicht eine intuitive Mustererkennung und Vergleich über mehrere Dimensionen gleichzeitig.
Wir haben untersucht, was Iris-Charts sind, ihre realen Anwendungen in verschiedenen Bereichen untersucht, ein Schritt-für-Schritt-Tutorial für die Erstellung dieser mit Python und gemeinsame Best Practices für ein effektives Design. Unabhängig davon, ob Sie wissenschaftliche Daten, Geschäftsmetriken oder andere multivariate Datensatze visualisieren, bieten Iris -Diagramme eine überzeugende Alternative zu herkömmlichen Visualisierungsmethoden.
Wie bei jeder Visualisierungstechnik liegt der Schlüssel zum Erfolg darin, Ihre Daten, Ihr Publikum und die Geschichte zu verstehen, die Sie erzählen möchten. IRIS -Diagramme zeichnen sich hervor, wenn Sie Beziehungen zwischen mehreren Variablen zeigen und Muster identifizieren müssen, die möglicherweise in anderen Diagrammtypen versteckt sein. Durch die Anwendung der in diesem Leitfaden enthaltenen Prinzipien und Techniken sind Sie gut ausgestattet, um effektive und aufschlussreiche IRIS-Diagramm-Visualisierungen zu erstellen.
Sind Sie bereit, Ihre eigenen Iris -Diagramme zu erstellen?
Laden Sie unser umfassendes IRIS -Diagramm -Toolkit mit Vorlagen, Codeproben und Entwurfsressourcen herunter.
Holen Sie sich das komplette Toolkit


